Download
1 / 161
1.62k likes | 1.75k Views
Understand concepts like probability models, sample spaces, and events in statistics. Learn how to calculate probabilities and practice with real-world examples.

E N D
Basics of Probability and Statistics K. Ramachandra Murthy http://www.isical.ac.in/~k.ramachandra/PR_Course.htm
Outline • Probability • Statistical Measures
Idea of Probability • Probability is the science of chance behavior • Chance behavior is unpredictable in the short run but has a regular and predictable pattern in the long run
Randomness • Random: individual outcomes are uncertain • But there is a regular distribution of outcomes in a large number of repetitions. • Example: select any number from a bag of numbers {1,2,3,…,100}
Random Experiment… • If an experiment has n possible outcomes [all equally likely to occur]. • …a random experiment is an action or process that leads to one of several possible outcomes. For example:
Relative-Frequency Probabilities • Relative frequency (proportion of occurrences) of an outcome settles down to one value over the long run. That one valueis then defined to be the probability of that outcome. • Can be determined (or checked) by observing a long series of independent trials (empirical data) • experience with many samples • simulation
Relative-Frequency Probabilities Coin flipping:
Probability Models • The sample space S of a random phenomenon is the set of all possible outcomes. • An event is an outcome or a set of outcomes (subset of the sample space). • A probability model is a mathematical description of long-run regularity consisting of a sample space S and a way of assigning probabilities to events.
Sample Space and Events Sample Space Event 3 Event 4 Event 1 Event 5 Event 2
Example Sample Space ={1,2,3,4,5,6} Rolling an odd number={2,4,6} Rolling an even number={2,4,6} Rolling a prime number={2,3,5}
Probability Model for Two Dice Random phenomenon: roll pair of fair dice.Sample space: Event: rolling even numbers on both dice
Probability Model for 52 card deck Random phenomenon:Arrange 52 card deckin a zigzag waySample space: Event: pick an ace
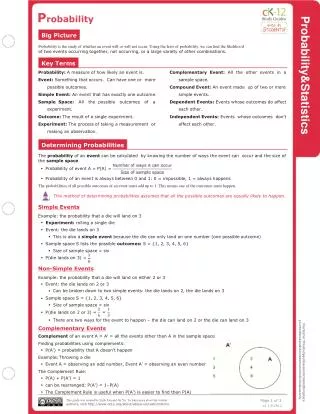
Probability What is a PROBABILITY? - Probability is the chance that some event will happen - It is the ratio of the number of ways a certain event can occur to the number of possible outcomes
Probability What is a PROBABILITY? number of favorable outcomes number of possible outcomes Examples that use Probability: (1) Dice, (2) Spinners, (3) Coins, (4) Deck of Cards, (5) Evens/Odds, (6) Alphabet, etc. P(event) =
Probability What is a PROBABILITY? 0 ¼ or .25 ½ or .5 ¾ or .75 1 Impossible Not Very Equally Likely Somewhat Certain Likely Likely
Probability of Simple Events Example 2: Roll a dice. What is the probability of rolling an even number? The probability of rolling an even number is 3 out of 6.
Probability of Simple Events Example 3: Roll a dice. Random phenomenon: roll pair of fair dice and count the number of pips on the up-faces. Find the probability of rolling a 5. P(roll a 5) = P( )+P( )+P( )+P( ) = 1/36 + 1/36 + 1/36 + 1/36 = 4/36 = 0.111
Probability of Simple Events Example 4: Spinners. What is the probability of spinning green? The probability of spinning green is 1 out of 4
Probability of Simple Events Example 5: Flip a coin. What is the probability of flipping a tail? The probability of spinning green is 1 out of 2
Probability of Simple Events Example 6: Deck of Cards. • What is the probability of picking a heart? The probability of picking a heart is 1 out of 4 • What is the probability of picking a non heart? The probability of picking a heart is 3 out of 4
Probability of Simple Events Key Concepts: - Probability is the chance that some event will happen - It is the ratio of the number of ways a certain even can occur to the total number of possible outcomes
Probability of Simple Events Guided Practice: Calculate the probability of each independent event. 1) P(black) = 2) P(1) = 3) P(odd) = 4) P(prime) =
Probability of Simple Events Guided Practice: Answers 1) P(black) = 4/8 2) P(1) = 1/8 3) P(odd) = 1/2 4) P(prime) = 1/2
Probability of Simple Events Independent Practice: Calculate the probability of each independent event. 1) P(red) = 2) P(2) = 3) P(not red) = 4) P(even) =
Probability of Simple Events Independent Practice: Answers 1) P(red) =1/2 2) P(2) = 1/4 3) P(not red) = 1/2 4) P(even) = 1/2
Probability of Simple Events Real World Example: A computer company manufactures 2,500 computers each day. An average of 100 of these computers are returned with defects. What is the probability that the computer you purchased is not defective?
Complementary Events • The complement of an event E is the set of all outcomes in a sample space that are not included in event E. • The complement of an event E is denoted by Properties of Probability:
Complementary Events • Example I: A sequence of 5 bits is randomly generated. What is the probability that at least one of these bits is zero? • Solution: There are 25= 32 possible outcomes of generating such a sequence. Define event E as at least one of the bits is zeros Then event , “none of the bits is zero”, includes only one of these outcomes, namely the sequence 11111. Therefore, p() = 1/32. Now p(E) can easily be computed as p(E) = 1 – p() = 1 – 1/32 = 31/32.
Complementary Events • Example II: What is the probability that at least two out of 36 people have the same birthday? • Solution: The sample space S encompasses all possibilities for the birthdays of the 36 people, so |S| = 36536. Let us consider the event (“no two people out of 36 have the same birthday”). includes P(365, 36) outcomes (365 possibilities for the first person’s birthday, 364 for the second, and so on). Then p() = P(365, 36)/36536 = 0.168, so p(E) = 0.832
The Multiplication Rule • If events A and B are independent, then the probability of two events, A and B occurring in a sequence (or simultaneously) is: • This rule can extend to any number of independent events. • Two events are independent if the occurrence of the first event does not affect the probability of the occurrence of the second event.
Mutually Exclusive Two events A and B are mutually exclusive if and only if: In a Venn diagram this means that event A is disjoint from event B. A and B are not M.E. A and B are M.E.
The Addition Rule • The probability that at least one of the events A or B will occur, P(A or B), is given by: • If events A and B are mutually exclusive, then the addition rule is simplified to: • This simplified rule can be extended to any number of mutually exclusive events.
The Addition and Multiplication Rule • Example: What is the probability of a positive integer selected at random from the set of positive integers {1,2,….,100} to be divisible by 2 or 5? • Solution: E2: “integer is divisible by 2” E5: “integer is divisible by 5” • E2= {2, 4, 6, …, 100} and |E2| = 50 p(E2) = 0.5 • E5= {5, 10, 15, …, 100} and|E5| = 20 p(E5) = 0.2
The Addition and Multiplication Rule • E2 E5 = {10, 20, 30, …, 100} and |E2 E5| = 10 p(E2 E5) = 0.1 • p(E2 E5) = p(E2) + p(E5)– p(E2 E5 ) p(E2 E5) = 0.5 + 0.2 – 0.1 = 0.6
Conditional Probability • We talk about conditional probability when the probability of one event depends on whether or not another event has occurred. • e.g. There are 2 red and 3 blue counters in a bag and, without looking, we take out one counter and do not replace it. • The probability of a 2ndcounter taken from the bag being red depends on whether the 1stwas red or blue. • Conditional probability problems can be solved by considering the individual possibilities or by using a table, a Venn diagram, a tree diagram or a formula.
Notation P(A B) means “the probability that event A occurs giventhat B has occurred”. This is conditional probability.
Low Medium High Total Male 12 33 7 Female 23 21 4 100 Example e.g. 1. The following table gives data on the type of car, grouped by petrol consumption, owned by 100 people. One person is selected at random. L is the event “the person owns a low rated car”
Example e.g. 1. The following table gives data on the type of car, grouped by petrol consumption, owned by 100 people. One person is selected at random. L is the event “the person owns a low rated car” F is the event “a female is chosen”. Low Medium High Total Male 12 33 7 Female 23 21 4 100
e.g. 1. The following table gives data on the type of car, grouped by petrol consumption, owned by 100 people. Low Medium High Total Male 12 33 7 Female 23 21 4 100 One person is selected at random. L is the event “the person owns a low rated car” F is the event “a female is chosen”.
Find (i) P(L) (ii) P(F and L)(iii) P(FL) e.g. 1. The following table gives data on the type of car, grouped by petrol consumption, owned by 100 people. Low Medium High Total Male 12 33 7 Female 23 21 4 100 One person is selected at random. L is the event “the person owns a low rated car” F is the event “a female is chosen”. We need to be careful which row or column we look at.
12 23 Find (i) P(L) (ii) P(F and L)(iii) P(FL) Low Low Medium High Total Solution: Male 12 33 7 Female 23 21 4 35 100 100 (i) P(L) =
Find (i) P(L) (ii) P(F and L)(iii) P(FL) Low Medium High Total Solution: Male 12 33 7 Female 23 23 21 4 100 100 (i) P(L) = The probability of selecting a female with a low rated car. (ii) P(F and L) =
Find (i) P(L) (ii) P(F and L)(iii) P(FL) (iii) P(F L) = Low Medium High Total Solution: Male 12 12 33 7 Female 23 23 21 4 35 100 (i) P(L) = (ii) P(F and L) = We must be careful with the denominators in (ii) and (iii). Here we are given the car is low rated. We want the total of that column. The probability of selecting a female given the car is low rated.
Notice that P(L) P(F L) Find (i) P(L) (ii) P(F and L)(iii) P(FL) (iii) P(F L) = So,P(F and L)= P(F L) P(L) Low Medium High Total Solution: Male 12 33 7 Female 23 21 4 100 (i) P(L) = (ii) P(F and L) = =P(F and L)
Conditional Probability P(F and L)= P(F L) P(L) • This result can be used to help solve harder conditional probability problems. • However, I haven’t proved the formula, just shown that it works for one particular problem. • We’ll just illustrate it again on a simple problem using a Venn diagram.
R F Red in the 1st packet e.g. 2. I have 2 packets of seeds. One contains 20 seeds and although they look the same, 8 will give red flowers and 12 blue. The 2nd packet has 25 seeds of which 15 will be red and 10 blue. Draw a Venn diagram and use it to illustrate the conditional probability formula. Solution: Let R be the event “ Red flower ” and F be the event “ First packet ”
R F Red in the 1st packet e.g. 2. I have 2 packets of seeds. One contains 20 seeds and although they look the same, 8 will give red flowers and 12 blue. The 2nd packet has 25 seeds of which 15 will be red and 10 blue. Draw a Venn diagram and use it to illustrate the conditional probability formula. Solution: Let R be the event “ Red flower ” and F be the event “ First packet ” 8
R F Blue in the 1st packet e.g. 2. I have 2 packets of seeds. One contains 20 seeds and although they look the same, 8 will give red flowers and 12 blue. The 2nd packet has 25 seeds of which 15 will be red and 10 blue. Draw a Venn diagram and use it to illustrate the conditional probability formula. Solution: Let R be the event “ Red flower ” and F be the event “ First packet ” 8