Download
1 / 64
640 likes | 792 Views
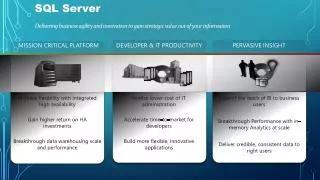
SQL Server. Delivering business agility and innovation to gain strategic value out of your information. PERVASIVE INSIGHT. MISSION CRITICAL PLATFORM. DEVELOPER & IT PRODUCTIVITY. Increase flexibility with integrated high availability Gain higher return on HA investments

E N D
SQL Server Delivering business agility and innovation to gain strategic value out of your information PERVASIVE INSIGHT MISSION CRITICAL PLATFORM DEVELOPER & IT PRODUCTIVITY Increase flexibility with integrated high availability Gain higher return on HA investments Breakthrough data warehousing scale and performance Realize lower cost of IT administration Accelerate time-to-market for developers Build more flexible, innovative applications Expand the reach of BI to business users Breakthrough Performance with in-memory Analytics at scale Deliver credible, consistent data to right users
What is REPORT ? Individuals and Organizations wants : way of displaying data in standardized way that facilitates decision making. Be able to access those reports from variety of applications, locations and devices. A report is any informational work made with the specific intention of relaying information in a widely presentable form. Reports use features such as graphics, images, voice, or specialized vocabulary in order to persuade that specific audience to undertake an action. One of the most common formats for presenting reports isIMRAD: Introduction, Methods, Results and Discussion
What is SSRS? SQL Server Reporting Services (SSRS) is a server-based report generation software system from Microsoft. Administered via a web interface, it can be used to prepare and deliver a variety of interactive and printed reports. SQL Server Reporting Services is Microsoft's SERVER-CENTRIC reporting plateform. SSRS competes with Crystal Reports and other business intelligence tools. Reporting Services was first released in 2004 as an add-on to SQL Server 2000. The second version was released as a part of SQL Server 2005 in November 2005. A third version was released as part of SQL Server 2008 R2 in April 2010. The latest version was released as part of SQL Server 2012 in March 2012.
Why Reporting Services? • Distributed processing - Portal • Uses Active Directory • Easy to install and administer • Integrated report development • Uses standard Internet technology • (HTTP & XML) • Works with Oracle and more
The Real Reason • Needed Reporting Tool Now! • Least expensive solution (No budget for Reporting Tool) • Already owned software SQL Server • Works with Oracle and many more… • Installed RS ourselves • Very Good Product Help available
Agility Security Cost Reporting Services Performance & Administration
Already Owned Enterprise Edition + No Annual Maintenance = $ 0.0 Pricing – MS Campus Agreement • Enterprise Edition • Much less than Web Focus or Oracle • Standard Edition • 3x less than • SQL Enterprise Edition
SQL Server License • RDBMS; • OLAP/Data warehouse; • Management Tools; • Integrated Security; • Reporting Services; • Email Notification Services; • More… • License includes all Features. • Features are not priced separately
Requirements • Microsoft Windows • 2000, 2003, & XP • SQL Server • IIS (Web Server) • ASP.NET Reporting Services is Clusterable and Scalable (Web Farm) Reporting Services is an ASP.NET application that uses SQL Server for its data storage
Authoring: Report developers can create reports to be published to the Report Server using Microsoft or third-party design tools that use Report Definition Language (RDL), an XML-based industry standard used to define reports • Management. Report definitions, folders, and resources are published and managed as a Web service. Managed reports can be executed either on demand or on a specified schedule, and are cached for consistency and performance • Delivery. Supports both on-demand (pull) and event-based (push) delivery of reports. Users can view reports in a Web-based format or in e-mail
Reporting Services Features • Part of the SQL Server 2005 Platform • Report Development • Visual report design • Business Intelligence Development Studio • Report Features • Grouping • Sorting • Filtering • Drill-Down and Drill-Through • Charting • XML-based Report Files (.rdl)
Reporting Services Features • Report Types • Table • Matrix • Charts • Report output: • Report Viewer (web site) • Page-based (HTML, TIFF, PDF) • Application integration (Web / Windows Forms) • Export Formats: • Adobe PDF, XML, Microsoft Excel, CSV, TSV • CSV
Reporting Services Features • Management • Web-based interface • Command-line management tools • Report Builder • Data models for creating ad-hoc reports • Programmability / Integration: • Application Programming Interface (API) • Web Services / Simple Object Access Protocol (SOAP) • Command-line utilities
REPORT Security • Report Authentication & Authorization via by Active Directory • Can Utilize Web Server & other security technology • SSL, IPSec, Firewall, etc
Reporting Services Architecture SharePoint Report Viewer Web Part Web Service Proxy Report Viewer SSMS Data Sources Web Services & URL Access Security Services Report Server Report Engine Output Formats Data Processing Security Delivery Targets (E-mail, SharePoint, Custom) Rendering Scheduling & Delivery RDCE Custom Report Item Custom Visualization Customized RDL SQL Server Catalog RDCE : Report Definition Customization Extension for Multi-Language Reports
Reporting Services Architecture • From SQL Server Books Online
SQL Sever Reporting and Alerting Increase Proactive Intelligence Empower users Increase efficiency • End User Alerting • Defined from within operational or ad-hoc reports • Intuitive Alert rules • Alerts self-managed through SharePoint • XLS/Word 2007/2010 • BIDS integrated with Dev10 shell • Power View • Highly visual design experience • Rich metadata-driven interactivity • Presentation-ready at all times • Enabled as SharePoint Shared Service • Built-in scale-out for RS Service Apps • SharePoint Cross-farm reporting • Integrated backup & recovery, ULS logging, PowerShell etc. • Managed Self Service BI – Corporate BI
Alerting Key Capabilities • Alert Messages • Description • Alert Rules • Alert Parameters • Alert Schedules • Daily, Weekly, Hourly, Minute • Start/End Date • Production Capabilities • Execution Log • Globalized Alert Rules • Localization ready • Scenario • Operational Reports • Stored Credentials • SharePoint Mode • SharePoint Permissions • Tools • Alert Designer • Alert Manager • Alert Rules • Simple rules • Static thresholds
Using the Report Wizard • Report Wizard Goals: • Provides a quick way to create basic reports • Defines a data connection and query • Includes formatting and grouping options • Creates a new RDL file • Launching the Report Wizard: • New Project Report Server Project Wizard • Add Item Report Wizard
Understanding Data Sources • Specifies connection information for reporting data • Supported Data Sources: • Any OLEDB / ODBC-compliant data source • Relational • SQL Server • Oracle • MS Access • OLAP / Multi-Dimensional • SQL Server Analysis Services • XML, Excel, CSV, TSV, etc.
Creating Data Sources • Data Source Details • Data source type • Connection options • Security credentials • Private Data Sources (Report-specific) • Stored within the report (.RDL) file • Shared Data Sources • Defined at the Project / Server level • Can be used across multiple reports • Useful for development/production environments
Dataset Details • Identifies data to be used for report generation • Can have many different datasets per report • Requires a data source (shared or embedded) • Fields are available for use in reports • Dataset Options • Query (Text or Stored Procedure) • Fields • Data Options • Parameters • Filters
Query Designer • Query Designer Features • Visual creation of joins • Can access tables, views, and functions • Column names and aliases • Query sorting and filtering options • Query results • Screen sections • Diagram Pane • Grid Pane • SQL Pane • Result Pane
Report Layout • Report • Page Header • Page Footer • Body (Report Area) • Table Regions • Header • Detail • Footer • Groups • Can specify page breaks
Report Layout: Demonstration • Report Requirements: • Show a list of all products by Category / Subcategory • Drill-down, sorting, and grouping are not required • Report Components: • Page Header • Report Title • Page Number • Report Data (Table)
Interactive Sorting • Query Sorting • Useful for setting a “default” sort order • Use an ORDER BY clause in the dataset query • Table-Level Sorting • Default sort order specified in the “Sorting” tab • Interactive Sorting • Data is sorted during report generation • Sorted values are used for report output • Can use a field or complex sort expression • May be dependent on grouping scope
Grouping and Drill-Down • Grouping • Helps to logically organize data • Can create sub-totals in group footer • Drill-Down • Group visibility can be dynamically-controlled by other columns/values • Report exports are based on the current view
Understanding Expressions • Statements used to specify values • Can be used in table cells • Expression Editor • Supports Intellisense • Uses Visual Basic-style syntax • Examples: • Globals!ReportName • Globals!PageNumber • Sum(Fields!SalesTotal.Value, “Sales") • CountDistinct(Fields!ProductCategory) • Fields!Employee.LastName + “,” + Fields!Employee.FirstName +
Filtering Options • Dataset / Query Level • Uses parameter variables to restrict data returned • Can also use stored procedure variables • Report Parameters • Determined at report run-time • Useful when users will be frequently changing settings • Object Filtering • Filter options for tables, charts, etc.
Dataset Filtering • Can improve performance by minimizing data returned • Best used when filtering details are known before report generation • Implemented using query parameters • Variables: @StartDate, @EndDate Query: SELECT * FROM Sales WHERE TransactionDate BETWEEN @StartDate AND @EndDate
Reporting Parameters • Evaluated at report run-time • Report Parameter Options: • Data Types • Prompt Options • Allow blank / null; Multi-value • Available Values • Non-Queried or From Query • Default values: • Non-Queried or From Query • Cascading Parameters
Reporting Services Components • SQL Server Reporting Services Service • Report Manager Web Site • Business Intelligence Development Studio • Databases: • ReportServer: • Report definitions, security settings, etc. • ReportServerTempDB: • Cached data and user session information • Components may be installed on different servers
Report Execution Options • Always run this report with the most recent data • Enable caching • Expired based on number of minutes • Expired based on a schedule • Render report from a snapshot • Report Execution timeouts • System Default • Specified number of seconds • None
Understanding Report Caching • Cache is created when a report is first run • Stores a copy of data in ReportServerTempDB • Can reduce impact on production performance • Data may be out-of-date • Expires after a pre-defined amount of time • Data source security settings must be configured
Understanding Schedules • Events are executed by SQL Server Agent service • Schedule Types • Report-Specific Schedules • Shared Schedules • Defined at the system level • Tips: • Keep track of time zones • Use shared schedules whenever possible to allow centralized management • Distribute reporting processing workload over time
Understanding Snapshots • Point-in-time view of the contents of a report • Data never changes • Report parameters must be defined before running the snapshot • Usually created on a schedule • End-of-month or end-of-year reports • Scheduling • Report-specific schedule • Shared schedule
Report History • Used to maintain snapshot copies over time • Often used for auditing or historical reference • Scheduling: • Store all snapshots • Use a report-specific schedule • Use a shared schedule • Options: • Keep an unlimited number of snapshots • Limit the number of copies of report history