Download
1 / 7
100 likes | 267 Views
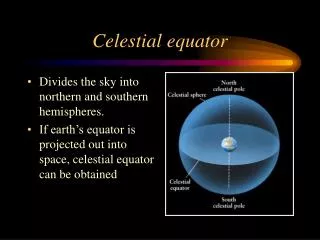
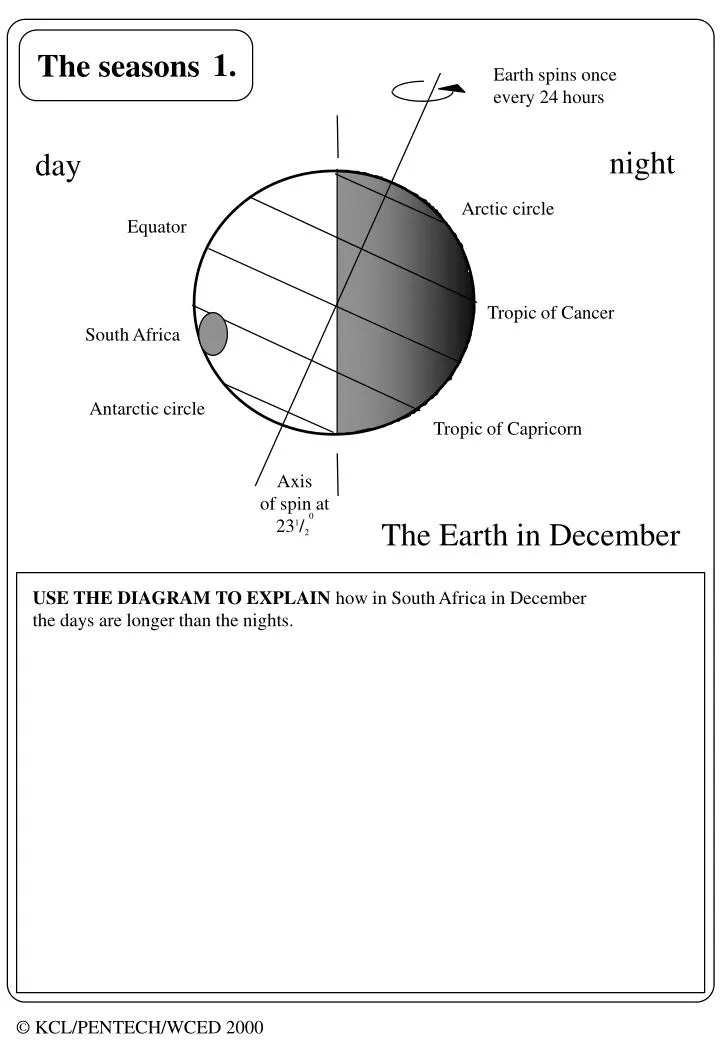
1. Earth spins once every 24 hours. night. day. Arctic circle. Equator. Tropic of Cancer. South Africa. Antarctic circle. Tropic of Capricorn. Axis of spin at 23 1 / 2 0. The Earth in December. USE THE DIAGRAM TO EXPLAIN how in South Africa in December

E N D
1. Earth spins once every 24 hours night day Arctic circle Equator Tropic of Cancer South Africa Antarctic circle Tropic of Capricorn Axis of spin at 231/20 The Earth in December USE THE DIAGRAM TO EXPLAIN how in South Africa in December the days are longer than the nights.
2. The table below gives the hours of daylight in Cape Town for different months of the year. Month of year Jan Feb Mar Apr May June July Aug Sept Oct Nov Dec Length of day 14h 13h 12h 11h 10h 10h 10h 11h 12h 13h 14h 14.5 PLOT a bar chart for this data to show the pattern. Lable the axes. 16 14 12 10 M N J D A J A S F M O J EXPLAIN how you would ESTIMATE the time of sunset for each month of the year.
3. Here is a bar chart for the time between sunrise and sunset in Cape Town and Gibraltar . Hours between sunrise and sunset 14 13 12 11 10 A M M J J A S N D O J F Month of the year DESCRIBE the pattern shown in the bar chart above.
4. Spinning Earth Earth circling the Sun March Sun June December September Use the diagram to EXPLAIN why the hours of daylight in South Africa vary throughout the year.
5. Looking East at the rising Sun Use what you know about day length and the seasons to DESCRIBE the pattern in these pictures.
6. The table below shows the maximum temperature in Cape Town throughout the year. PLOT the temperatures on the bar chart below. Average temperature in degrees Celsius 32 28 24 20 16 12 July June May April March August October January February December November September Month of the year
7. June December Sun light South Africa South Africa Sun light EXPLAIN how the diagram above shows that it will be hotter in South Africa in December than it is in June.