Download
1 / 30
300 likes | 402 Views
Cascadia Border Operations, Issues, and Consequences for the Agrifood Market. Anne Goodchild Assistant Professor Civil and Environmental Engineering University of Washington May 23, 2008. Pacific Highway Crossing $43 Million in trade each day 500,000 trucks in 2005

E N D
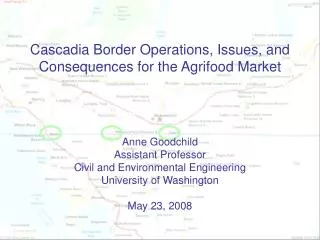
Cascadia Border Operations, Issues, and Consequences for the Agrifood Market Anne Goodchild Assistant Professor Civil and Environmental Engineering University of Washington May 23, 2008
Pacific Highway Crossing • $43 Million in trade each day • 500,000 trucks in 2005 • 4th busiest N. border commercial crossing • Busiest crossing W. of Detroit • Transit times can be long & unpredictable • Congested during peak periods • Connects the mega regions of Vancouver and Seattle. Courtesy of WCOG
Only top 5 crossing West of Mississippi US Census Bureau, 2008
Top 5 US/Mexico Crossings US Census Bureau, 2008
Champlain-Rouses Point, NY Southbound vehicle commodity data US Census Bureau, 2008
Dominated by food and agricultural products (9%) Courtesy of WCOG
Motivation • Much of the existing literature has overlooked the impact of border operations on agribusiness, and classifies it as non time sensitive • For Cascadia, however, these are our most time critical goods, and are very important to the regional economy.
Programs to reduce delay and increase trust • Advance Electronic Presentation of Cargo Information (ACE ) • Electronic manifest filing • More information submitted • Reduces errors • Process improvements: 2006 study shows secondary inspections reduced by 50% • Now required for all crossers
Programs to reduce delay and increase trust • Customs Trade Partnership Against Terrorism (C-TPAT) • Voluntary security practices that increase trust • Companies comply to reduce wait time • CBP introduced the program to increase security
Programs to reduce delay and increase trust • Free and Secure Trade (FAST) • Driver must be US citizen or permanent resident • Passengers, driver, vehicle, goods, carrier, and importer must all be FAST certified • Must be C-TPAT approved • Difficult for LTL and package carriers • Separate border infrastructure (8am-8pm) • Inspection and wait times significantly reduced
FAST Border Crossing Times 20minutes 4 hours
Seasonal Variation
Disruptions off-hours
SB more variable
Delay summary • Variability more difficult for supply chain management than average. • Average lower in low flow times, but variability increased • NB and SB have different operating characteristics that affect delay
Previous Research • Impact of border crossing time variability on regional supply chains • Examination of the cause of very long delays (>2 hours) • Description of Cascadia regional freight transportation • Examination of long-term delay patterns • Seasonal patterns • Daily patterns Data from Pacific Highway Crossing, GPS data, manifest data, truck counts, operations survey, interviews with carriers
Previous Research Findings • Variability in delay increases cost beyond average delay • Delays are dramatically reduced for FAST approved trucks • Very long delays (> 2 hours) are very problematic • Regional industry is not tightly scheduled due to typical distances and ability to predict travel times • Cascadia has a unique profile with different issues than Michigan/Ontario crossings
Recommendations • Take advantage of existing programs where possible • FAST, C-TPAT, ACE • Ensure paperwork in place at all exchange points • Our current research shows this is responsible for about 25% of border delay • Learn about the performance of borders used • Cross outside of high flow hours but within program hours • Use lower volume crossings • Locate terminals before border crossing • Consider other modes • Dedicate resources to managing these issues
Approximate location of BC Piezo WIM Signal-controlled stop-bar for non-FAST trucks RPM Primary FAST lane SB Non FAST SB Primary Non FAST route for parking and rejoining queue - SB All trucks NB NB holding for outbound paperwork NB Route for parking if still need to file entry, secondary inspection, etc. Future (2yrs) NB truck alignment
Southbound Routes Puget Sound to Vancouver: 150 miles