Download
1 / 11
110 likes | 146 Views
Learn about flow cytometric analysis for phytoplankton cells and colonies with handsfree, fast, and precise particle counting. Utilize the large size range and flow rate for accurate measurements and classification of data. Access raw optical data for detailed analysis. Explore in-situ flow cytometry applications with CytoBuoy instruments. Visit www.cytobuoy.com for more information and resources.

E N D
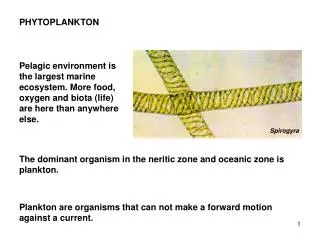
Handsfree counting and classificationof phytoplankton cells and colonies
GENERAL PRINCIPLE OF FLOW CYTOMETRIC ANALYSIS Flow cytometers count and analyse individual particles in a fluid. Fast and one by one. The analysis consist of forward and sideward scattered light as well as fluorescence of the cells. The cells are funneled by a sheath fluid in single file through a laser beam focus at typically 1,000 or more per second. The detected optical signals from each passing particle are digitized and listed into correlated data. If a sorter unit is present, individual particles may be sorted physically depending on their optical signals.
LARGE SIZE RANGE + LARGE FLOW RATE The capability to quantatively measure a wide particle size range was introduced in the (Eur)OPA instruments, involving wide bore, low shear fluidics and basic digital electronics. The non-gaussian flat laser focus of CytoSense allows much higher flow rates without compromizing data quality. The digitized signal courses of measured individual particles are made available as raw optical data for classification purposes.
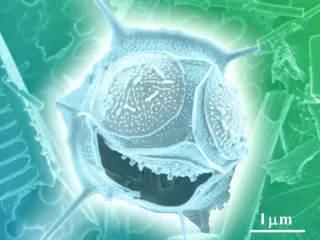
1-DIMENSIONAL SCANNING FLOW CYTOMETRY CytoSense raw data ouput of a double P. Pungens cell
Dataview and Cytoklus Particle level data: optical 1-D scan data sets of individual particles. These data sets are stored for all particles detected. Sample level data: all detected particles are shown as a dot in a scatterplot or a count in a univariate distribution. DATAVIEW CYTOKLUS Overview level data: Results presented for series of samples
Making a selection set from a culture or distinguishable cluster in a field sample
The selection sets may find single individuals from a large number of other particles
IN-SITU FLOW CYTOMETRYCytoBuoy instrument platforms AutoSub mission submarine lab buoy ferry wire To 250 m depth
Countings of 2 groups of Leptocylindricus minimus (basing on pulse data) from CytoSense data measured automatically on the R/V Heincke North Sea cruise going from the Weiss Bank (ca. 160 km off shore) to Terschelling Island (NL). Vertical: the number of individuals per ml of sea water; Horizontal: sample nr. (76 samples taken on 10 minute / 2 km intervals )
Find us on www.cytobuoy.com For those interested we have a mini CD with: + CytoBuoy web site (info and papers) + basic DataView and CytoClus software plus various measured data THANK YOU !