Download
1 / 14
140 likes | 165 Views
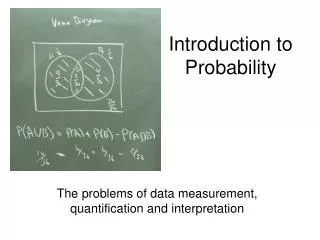
Learn about probability, set-theoretic view, conditional probability, independence, Bayes's Theorem, random variables, and statistics in this comprehensive guide.

E N D
Two Schools • Frequentists: fraction of times a event occurs if it is repeated N times • Bayesians: a probability is a degree of belief
Set-Theoretic Point of View of Probability • Consider a set S. For each subset X of S, we associate a number 0 ≤ P(X) ≤ 1, such that P(Ø) = 0, P(S) = 1, P(AB) = P(A) + P(B) - P(AB)
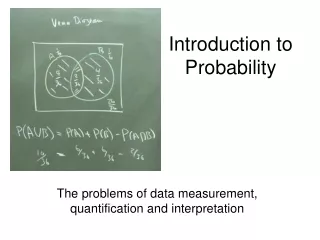
Venn Diagram P(AB) = P(A) + P(B) - P(AB) : union, or : intersection, and S A A B B
Mutual Exclusion • If two events (subsets) A and B cannot happen simultaneously, i.e., AB = Ø, we say A and B are mutually exclusive events. • For mutually exclusive events, P(AB) = P(A) + P(B)
Conditional Probability • We define conditional probability of A given B, as Assuming P(B) > 0.
Independence • If P(A|B) = P(A) , then we say A is independent of B. • Equivalently, P(AB) = P(A) P(B), if A and B are independent.
Bayes’s Theorem • This theorem gives the relationship between P(A|B) and P(B|A): This equation forms the basis for Bayesian statistical analysis.
Random Variable • A variable X that takes “random” values. We assume that it follows a probability distribution, P(x). • Discrete variable: p1, p2, … • Continuous variable: P(x)dx gives the probability that X falls between x and x +dx.
Cumulative Distribution Function • The distribution function is defined as F(x) = P(X ≤ x). • This definition applies equally well for discrete and continuous random variables.
Statistic of a Random Variable • Mean <X> = (1/N) ∑ xi • Variance σ2 = <X2> - <X>2 • Correlation <X Y> - <X><Y>
Expectation Value • If the probability distribution is known, the expectation value (average value) can be computed as (for continuous variable)