Download
1 / 21
230 likes | 518 Views
Water pollution in Elefsina. Sofia Koukoura Natalia Bolou Philip Siaplaouras. Purposes & Goals. To determine the quality of the Elefsina's sea water Identify the sources of pollution Compare industrial & residental pollution To conclude to some results regarding the data collected.

E N D
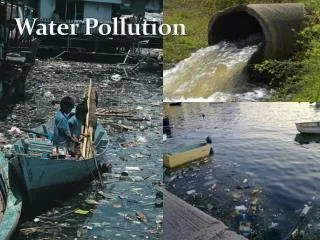
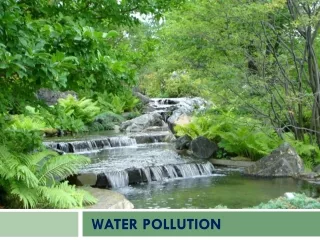
Water pollution in Elefsina Sofia Koukoura Natalia Bolou Philip Siaplaouras
Purposes & Goals To determine the quality of the Elefsina's sea water Identify the sources of pollution Compare industrial & residental pollution To conclude to some results regarding the data collected
Hypothesis At the beginning we thought that the sea near to an industrial area (Elefsina) would be much more polluted than the sea in the residential area. More specifically about Aspropirgos, we thought that we would find there certain elements that could prove the existence of pollution and eutrofication. Eutrofication: is caused by the continuous enrichment of the water with nutrients. The presence of these essential nutrients causes the exponential increase of plants and the distraction of the ecological balance
Sources of pollution in Elefsina • Landfill of Ano Liosia • Sea transports • Industrial units
Design of our research The pupils are divided in 4 teams, 2 for the industrial areas and 2 for non-industrial. All teams travelled to get water samples from two distinct parts of Elefsina bay (Aspropyrgos for industrial areas and Loutropyrgos for non-industrial)
Air Particles • We began with filtering the samples in preweighted • filters • 2L from Aspropyrgos' sample • 2L from Loutropyrgos sample • The filters which kept the air particles were left for one week in a drier with the aim of keeping away the water. By removing the mass of the filters we would find the mass ofthe air particles.
Suspended particles (Results) Sample Air Particles (mg/L) Aspropyrgos 9,5 Loutropyrgos 9,0
NO2- In order to determine the quantity of the NO2- we followed the forthcoming procedure: 40ml of filtered sample + 5ml of solution A (we waited for 5min) + 5ml of solution B (we waited for 10min) and we measured the absorption of singly frequenced light from the final (coloured) product.
In order to get some useful results from the measured absorbation ratios we had to give the computer some absorbation values from solutions with known concentrations. After “feeding” the machine with these values we could easily compute the concentration using simple mathematical functions.
Concentration in NO2- Absorption 0,1 0,0922 0,2 0,1572 0,3 0,2863
A= 0,4726 c + 0,0525 Sample Absorption Average absorption Aspropyrgos Measurement 1: 0,0546 0,0536 Measurement 2: 0,0526 Loutropyrgos Measurement 1: 0,0571 0,0556 Measurement 2: 0,0541
Results (NO2-) Sample C (μgions/L) Aspropyrgos 0,0023 Loutropyrgos 0,0065
Chlorophyll We had strained in two filters • 2L from Aspropyrgos sample • 2L from Loutropyrgos sample. These filters were put into centrifugal pipes and were contemplated with acetone. The centrifugal procedure followed and after that the measurement of the absorption of the light. Firstly, the absorption measurements were carried out in the plain samples and then we measured again after adding 8 drops of solution HCl. By using a mathematical equation we were able to find the concentration of chlorophyll in the samples.
Aspropyrgos sample Wave length Absorption A0 “sample’s” Absorption Aa “sample’s + HCl” 665nm 0,8460 0,9730 750nm 0,7605 0,8480
Loutropyrgos sample Wave length Absorption A0 “sample’s” Absorption Aa “sample’s + HCl” 665nm 0,5402 0,4877 750nm 0,4988 0,4663
Chlorophyll results Sample Concentration (μg/L) Aspropyrgos 0,8437 Loutropyrgos 0,4272 C chlorophyll-a = 26,7 ·| E6650 – E665a |·8 V·5
CONCLUSION • Aspropyrgos' waters, despite being in an industrial area, has a lower concentration in NO2- • Aspropyrgos' waters have slightly more air particles. This small difference is not analogous to the tremendously different environment. Thus, the concentration of air particles cannot be used as an evidence of pollution • Although Aspropyrgos' waters have a larger concentration in Chlorophyl, this is not due to eutrofication, as originally thought.
Proposals • Prohibition of factory waste • Control over the use of chemical fertilizers • Control over the naval waste thrown into the gulf