Download
1 / 12
120 likes | 223 Views
This report outlines proceedings from a UNFCCC workshop focused on enhancing Annex I Parties' reporting on greenhouse gas (GHG) emissions projections and the total effect of policies and measures (PaMs). Key discussion points include the UNFCCC reporting guidelines, the importance of consistent reporting across scenarios, and examples of best practices. Challenges identified in reporting include inconsistencies and lack of transparency. The report emphasizes the need for improved methodologies and comprehensive assessments to support countries in delivering accurate climate responsibility reports.

E N D
Reporting on Projections and the Total Effect of Policies and Measures Introductory presentation by the UNFCCC secretariat Workshop on the preparation of fourth national communications from Annex I Parties Dublin, 30 September – 1 October 2004
Overview • Introduction • UNFCCC reporting guidelines, main provisions relevant to reporting on projections and the total effect of policies and measures • C&S report of NC3s, some general issues and problems identified • IDRs of NC3s, examples of good practice in reporting on projections and the overall effect of policies and measures • Some points for discussion
Introduction • Article 4.2(b): Annex I Parties shall report pursuant to Article 12 detailed information on their PaMs adopted under Article 4.2 (a) as well as on their resulting projected GHG emissions
UNFCCC Reporting Guidelines (1) • Purpose • …to give an indication of future trends in GHG emissions and removals, based on the implemented and adopted PaMs, and to give an indication of the path of emissions and removals without such PaMs… • Scenarios: Parties shall report “with measures” (WM) scenarios and may report “with additional measures” (WAM) and “without measures” (WOM) scenarios • Consistency between projections and inventory data (WM and WAM starting point last year of inventory data, 2004; WOM 1990 or 1990) • Coverage • Reporting by sector, consistent with sectors in the PaMs section (energy, transport, industry, agriculture, forestry and waste management) • All six gases, also precursors and SO2; by sector and totals using GWP • Separate reporting on projections on international bunker fuel • Timing: 2005, 2010, 2015 and 2020; sample diagram: fig.1 of the guidelines
UNFCCC Reporting Guidelines (3) • Assessment of aggregated effect of PaMs, or why a “without measures” scenario is important • Effects of individual PaMs are reported in the PAMs section, total effects are reported in projections section (link with PaMs); • Parties shall report on total effect of PaMs • What types of effects: Ex-post (for 1995 and 2000) and ex-ante (for 2005, 2010, 2015 and 2020) effects • How to report (estimate) total effect • Total effect as a difference between “with measures “ and “without measures” scenario • Total effects as an aggregation of individual effect of each significant PaMs (link with PaMs)
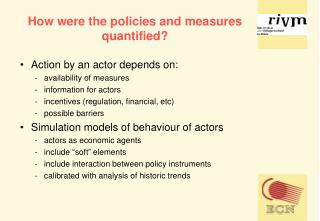
UNFCCC Reporting Guidelines (4) • Methodology • Description of the model to allow the reader a basic understanding of the approach, and its attributes: • Gases and sectors covered • Type of model, its original purpose and any modifications • Strengths and weaknesses of the model • Accounting for overlap and synergies between PaMs • Key assumptions and differences in assumptions between the current NC and the previous NC • Sensitivity of projections to key assumptions (summary Table 2 of the guidelines)
Findings and Problems Encountered (1) • Findings: • Improved reporting (new guidelines and enhanced modeling capacity and human resources) • More countries provided more than one scenario, but few provided WOM scenario (WM-30, WAM-21, WOM-7) • Good coverage of projections by gas, still not all countries reported projections on fluorinated gases • Good coverage of projections by sector, but still not all countries provided projections for transport and forestry • Projections on international bunker fuels not always provided
Findings and Problems Encountered (2) • Problems encountered: • Several countries provided only one scenario (~ 10) and in several cases scenario definition did not follow the UNFCCC guidelines (~ 6) • Reporting of information by sector and by gas was not always transparent and consistent within individual NCs (and not easily comparable across different NCs) • Some inconsistencies between projections and emission inventories and between projections and PaMs (not the same set of PaMs or total effects are different) • Limited information on the type of models used, its attributes and sensitivity analysis • Description of key assumptions not always transparent, not always clear what triggered changes in key assumptions compared to previous NCs • Limited analysis of results and impacts of key drivers
Examples of Good Practice • Reporting on all 3 scenarios (BUL, CAN, FRA, ITA, JPN, SVK) • Consistency between reporting by gas and sector and in line with IPCC categories: Denmark • Concise, but clear description of the model and key assumptions: Australia, Bulgaria, Canada, the Netherlands • Interpretation of the results and impacts from key assumptions/drivers; Finland (changes in GDP, energy efficiency improvement, impacts from new technologies), Australia (attribution of the overall effect from PaMs to different sectors) • Clearly explained changes between projections reported in the NC2 and NC3: the U.K. • Sensitivity analysis: Australia, Canada, New Zealand, Sweden, United States • Uncertainty analysis using the Monte Carlo method: the Netherlands
Starting Points for the Discussion • What is the role of different scenarios (WM, WOM and WAM) and why it is important to report on more than one scenario following the guidelines definitions on these scenarios? • How to ensure transparency and consistency in reporting of information by sector and by gas (table from the projections workshop)? • How to ensure consistency in reporting on projections with inventories and policies and measures sections of the national communication (IPCC categories, table from projections workshop, total and individual effect from PaMs)? • How to provide clear, but concise description of models and key assumptions (explanation on the changes in key assumptions)? • How to improve the reporting on the analysis of results from projections, e.g. the impact from key assumptions and drivers, and policies and measures? • Sensitivity analysis: is it just a reporting requirement or a useful tool to facilitate transparency in assessment and reporting in the NCs, if such analysis is used, how to report on it?