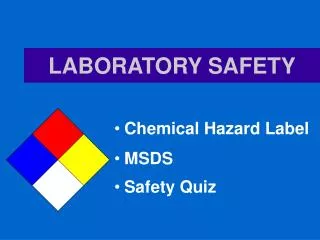
Understanding Laboratory Safety and Scientific Method Essentials
670 likes | 791 Views
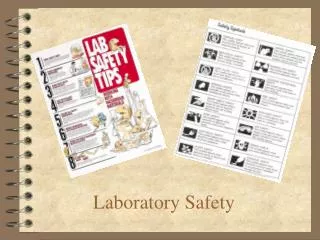
This guide outlines crucial laboratory safety protocols, emphasizing do's and don'ts to ensure a secure working environment. It also delves into the scientific method, illustrating how to make observations, classify data, hypothesize, and conduct experiments. Key science skills like inferring, estimating, measuring, and analyzing are essential for gathering information about the natural world. By understanding these principles, students can effectively engage in scientific inquiry and protect themselves while in the lab.

Understanding Laboratory Safety and Scientific Method Essentials
E N D
Presentation Transcript
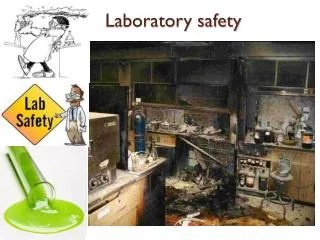
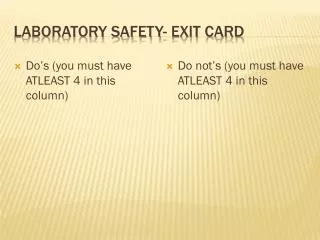
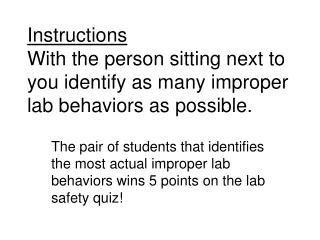
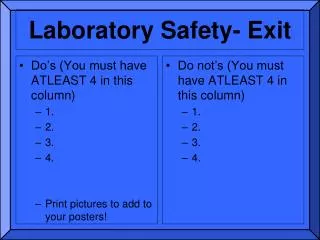
Laboratory Safety- Exit • Do’s (You must have ATLEAST 4 in this column) • 1. • 2. • 3. • 4. • Print pictures to add to your posters! • Do not’s (You must have ATLEAST 4 in this column) • 1. • 2. • 3. • 4.
Do Now- Journal Make as many observations as you can about this picture. Think about this… What is the scientific method? What are the 5 senses?
Chapter 1 “STUDYING SCIENCE”
1.1 Science Skills and Methods • Objectives • Identify and use science skills. • Describe a controlled experiment. • Apply a scientific method.
What is Science? • Science is a way to gather and organize information about the natural world. • Scientists do this by using such skills as observing, inferring, estimating, measuring, predicting, classifying, hypothesizing, recording, organizing and analyzing.
Science Skills • Although there are many different fields of scientific study, all scientists use these basic science skills to search for knowledge about the natural world.
Observe • The most direct way to gain knowledge about something in nature is to observe. • When you observe, you use one or more of your senses. Your senses are sight, touch, taste, smell, and hearing.
Look at the objects in Figure 1.1. 1.1 List as many observations as you can about each object. Which senses do you use most often?
Infer • When you suggest a possible explanation for an observation, you make an inference, or you infer. • You often can make more than one inference to explain the same observation. What can you infer about these symbols?
Estimate • When you estimate, you make a careful guess. • Estimating skills are used to gather information when exact measurements aren't needed. Estimate the number of blocks in the cube above.
Measure • When you need exact information about an observation, you measure. Count the number of crystals for a more exact measurement.
Predict • When you predict, you state what you think might happen in the future. • Predictions are based on past experiences and observations.
Classify • When you classify, you group things together based on how they are alike. • You can group things in many different ways, such as size, color, shape, or any other characteristic. What are some different ways to classify these rocks?
Hypothesize • When you state a hypothesis, or hypothesize, you suggest a possible answer to a question or problem. • Your answer is based on information that you know. Think of a hypothesis as an explanation that states why something may always occur.
Testing Your Hypothesis • You can test a hypothesis by conducting an experiment. • Your observations, research, and the results of experiments should support your hypothesis. • What if it doesn’t?
Record and Organize • Careful record keeping is an important part of science. • You can record and organize data in a number ways such as using tables, charts, graphs, diagrams and flowcharts
Analyze • After data are recorded and organized, you need to analyze it. • When you analyze data, you look for trends or patterns to see whether or not your data supports your hypothesis. DATA
Experiments • A good way to get answers to questions in science is to do experiments. • Experiments need to be carefully designed to test an idea, prediction, hypothesis, or inference.
Controlled Experiments • Most experiments are controlled experiments. • A controlled experiment has two test groups-the control group and the experimental group. Scientists repeat experiments to check their data and conclusions.
Control & Experimental Groups • The control group is a standard by which any change can be measured. • In the experimental group, all the factors except one are kept the same as those in the control group. • The factors that are kept the same are called constants. • The factor that is changed by the person doing the experiment is called the variable.
Question: WHY DOES MY GRANDMOTER ADD SALT TO THE WATER BEFORE SHE COOKS SPAGHETTI?
A Controlled Experiment Hypothesis: If adding salt to water will then it will increase the temperature at which water boils Each beaker has the same amount of distilled water. Each beaker of water was heated at the same setting. Salt was added to the experimental beaker. The water in the beakers were stirred for one minute. A thermometer measured the temperature in both beakers.
The unsalted water boiled at 100°C. The salted water boiled at a higher temperature. Do the observations and results support the hypothesis? YES
Scientific Method • The phrase scientific method can be used to describe how scientists find out about the natural world. • The scientific method refers to a systemized method of using science skills to test ideas, inferences, predictions, and hypotheses.
Scientific Method • Think of a science problem or question. • Now, write a description of an experiment that will solve it. • Use the steps in Figure 1.6 on page 8, with the exception of analyze data and conclude to help.
Facts, Theories, and Laws • In science, a fact is a true statement. Science facts are always based on observations, studies, and repeated tests and experiments. • Gathering facts is an important part of developing a good hypothesis.
Facts, Theories, and Laws • A scientific law or theory is a hypothesis that has been thoroughly tested and no contradictions have been found. Darwin’ s theory of evolution
Facts, Theories, and Laws • A Scientific law describes how an event occurs. • Scientific laws are usually stated in mathematical terms.
Models in Science • Models are used to represent real objects. Some models are drawings, such as diagrams and maps. • Often models are built from real materials and are working models of the real object. Plane Model All models are plans from which real objects can be built
Chapter 1Section 2 Measuring with Scientific Units
1.2 Measuring With Scientific Units • Objectives • Identify the base units used in the SI system. • Explain the use of scientific notation. • Compare volume, mass and density. • Measure length, mass and temperature using SI Units.
Measuring With Scientific Units • Did you know that your feet get bigger during the day?
SI Units • The system of measurement used throughout most of the world today is the Systeme International d'Unites, orSI system. • It is also called the metric system. Basic SI Units of measure
SI Units Unlike other systems of measurement, SI units are based on multiples of ten. Prefixes such as kilo- orcenti- indicateunits larger or smaller than the basic SI units.
Length The basic SI unit of length is the meter (m). You will measure many distances that are less than 1 meter. The numbers to the top of this metric ruler represent centimeters. How many centimeters is this pencil? 19 cm.
Volume • Volume is the amount of space that something occupies. • The SI unit of volume is the cubic meter (m3). • A convenient unit for everyday use is the liter (L). Meniscus A graduated cylinder is used to measure liquid volumes.
Mass • Mass is the amount of matter that an object contains. • The basic SI unit of mass is the gram (g). To determine an object's mass, you use a tool called a balance.
Density • Mass is related to another important quantity called density. • Density tells you how much matter is packed into a given volume of space. • The units of density are grams of matter per cubic centimeter (g/cm3). The number of mL the water level rises is equal to the volume of the submerged object
Density You can calculate the density of an object by using this mathematical formula: Density = g/ml Example: Calculate the density of a piece of aluminum if a 50 mL block weighs 135 g. Solution: Apply the formula: Density = 135 g = 2.70 g/mL 50 mL
Temperature • When you are healthy, your normal body temperature is about 98.6o Fahrenheit (F). • On the Celsius scale, which is used internationally and in science, your normal body temperature measures about 37o Celsius (C). On the Celsius scale, water freezes at 0oC and boils at 100oC
Time • The basic SI unit of time is the second (s). • Amounts of time less than one second are measured in milliseconds (ms). • One millisecond is 1/1,000 of one second.
Scientific Notation • Scientists often work with very long numbers. • To save time, they write these numbers in scientific notation. • In scientific notation, a number is written as the product of two numbers. 2.68 X 10¹⁵ or 1.5 X 10⁻¹² • For example, the distance from the earth to the moon is about 384,400 km (238,855 miles) or in scientific notation, 3.844 x 10⁵ km.
Skills Workout List some things that you think are so big or so small that scientific notation would be needed to write their measurement. The thickness of a piece of paper = app. 1.0 X 10⁻⁴ m The circumference of the Earth = app 4 .0 X 104 km The distance from Earth to Pluto = app. 6.0 X 10⁹ The size of a virus = app. 2.0 X 10⁻⁹
Chapter 1Section 3 Graphing
1.3 Graphing • Objectives • Describe three types of graphs. • Identify the parts of a line graph. • Analyze data and plan a graph.
Graphing • A graph is a picture of data that shows numerical data in diagram form. A graph makes it easier to understand information.