Download
1 / 20
200 likes | 443 Views
From 1900 to 1960, the population of Orlando, Florida was growing at a rate of 3% per year. Orlando’s population in 1900 was 13,850. Write a formula to express population P after t years (from 1900 to 1960) as an exponential function. What is the yearly growth factor?

E N D
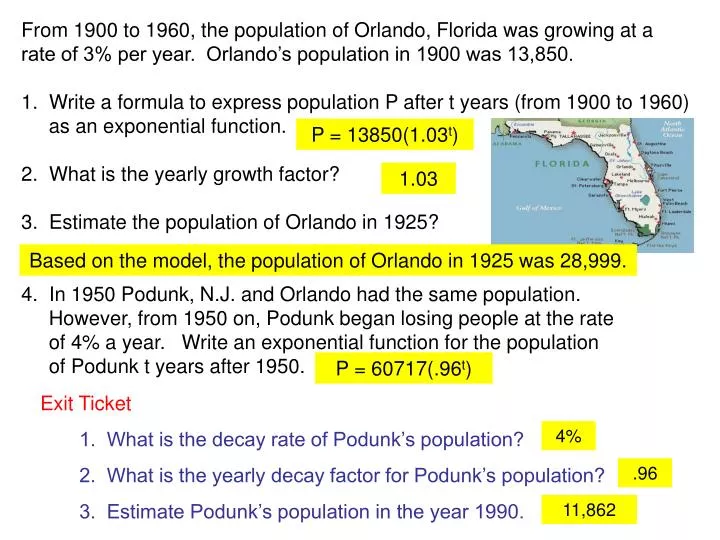
From 1900 to 1960, the population of Orlando, Florida was growing at a rate of 3% per year. Orlando’s population in 1900 was 13,850. • Write a formula to express population P after t years (from 1900 to 1960) as an exponential function. • What is the yearly growth factor? • Estimate the population of Orlando in 1925? • In 1950 Podunk, N.J. and Orlando had the same population. However, from 1950 on, Podunk began losing people at the rate of 4% a year. Write an exponential function for the population of Podunk t years after 1950. P = 13850(1.03t) 1.03 Based on the model, the population of Orlando in 1925 was 28,999. P = 60717(.96t) Exit Ticket 1. What is the decay rate of Podunk’s population? 2. What is the yearly decay factor for Podunk’s population? 3. Estimate Podunk’s population in the year 1990. 4% .96 11,862
Answers to even-numbered HW problems Section 4.1 S-2f (2) = 3.5344, f(x) = 400(.094x) S-4 Decreasing S-6 Concave up S-8 y = 10(1.07x) S-10 y = 50(1.09x) S-12 y = 13(.94x) Ex 2 f(x) = 200(.73x) Ex 4 a. N(1.5) = 8,242 is the number of individuals 15 years later. b. 77%
Global warming has been in the news a great deal lately and is recognized as a serious environmental problem. Aerial surveys of the Arctic ice sheet have uncovered a lake in the midst of the ice sheet where once there was solid ice. Arctic lake melts out of sea ice into ocean By Frank D. Roylance - The Baltimore Sun (Sept 23, 2006) Something unusual is going on in the Beaufort Sea, a remote part of the Arctic Ocean north of Alaska. A huge "lake" bigger than the state of Indiana has melted out of the sea ice. "The reason we're tracking it is because we had never seen anything like that before," said Mark C. Serreze, senior research scientist at the National Snow and Ice Data Center in Boulder, Colo. But this one, covering 38,000 square miles, is unique in the memory of scientists who watch the Arctic ice closely because they see it as a bellwether for the effects of global warming. Since the year 2002, the aerial surveys have provided the data in the following table for the increasing surface area of this lake.
Graph the data using years since 2002. What model would be appropriate for this data?
Try Where A = surface area and t = years since 2002
Because the ratios of the areas for successive time increments are the same, the data are exponential. The yearly growth factor is the ratio 1.095. Write the equation of an exponential model for this data. where A = area and t = years since 2002. The yearly growth rate is 9.5%. What is the yearly growth rate?
Modeling exponential data • To test whether data with evenly spaced values for the variable show exponential growth or decay, calculate successive quotients. If the quotients are all (approximately) the same, it is appropriate to model the data with an exponential function. If the quotients are not all about the same, some other model will be needed. • To model exponential data, use the common successive quotient for the growth (or decay) factor if the data are measured in 1-unit increments.
The average pulse rate of a man at rest is 60 beats per minute (BPM). The chart shows the average pulse rate of a man each minute after he begins exercising. 1. Show that an exponential model would be appropriate for the data. Round all calculations to the nearest hundredth. 2. What is the growth factor per minute? Round your answer to the nearest hundredth. 3. Find an exponential model for the pulse rate P as a function of the number of minutes t of exercise. 4. Based on the model, what would be the pulse rate after 6 minutes?
The average pulse rate of a man at rest is 60 beats per minute (BPM). The chart shows the average pulse rate of a man each minute after he begins exercising. 1. Show that an exponential model would be appropriate for the data. Round all calculations to the nearest hundredth. 2. What is the growth factor per minute? Round your answer to the nearest hundredth. 3. Find an exponential model for the pulse rate P as a function of the number of minutes t of exercise. Since the ratios of successive pulse rates are approximately equal, the data can be modeled with an exponential function. 4. Based on the model, what would be the pulse rate after 6 minutes?
The average pulse rate of a man at rest is 60 beats per minute (BPM). The chart shows the average pulse rate of a man each minute after he begins exercising. 1. Show that an exponential model would be appropriate for the data. Round all calculations to the nearest hundredth. 2. What is the growth factor per minute? Round your answer to the nearest hundredth. 3. Find an exponential model for the pulse rate P as a function of the number of minutes t of exercise. Since the ratios of successive pulse rates are approximately equal, the data can be modeled with an exponential function. The growth factor per minute is approximately 1.12. 4. Based on the model, what would be the pulse rate after 6 minutes?
The average pulse rate of a man at rest is 60 beats per minute (BPM). The chart shows the average pulse rate of a man each minute after he begins exercising. 1. Show that an exponential model would be appropriate for the data. Round all calculations to the nearest hundredth. 2. What is the growth factor per minute? Round your answer to the nearest hundredth. 3. Find an exponential model for the pulse rate P as a function of the number of minutes t of exercise. Since the ratios of successive pulse rates are approximately equal, the data can be modeled with an exponential function. The growth factor per minute is approximately 1.12. The exponential model for the data is still where P = pulse rate and t = number of minutes of exercise. 4. Based on the model, what would be the pulse rate after 6 minutes?
The average pulse rate of a man at rest is 60 beats per minute (BPM). The chart shows the average pulse rate of a man each minute after he begins exercising. 1. Show that an exponential model would be appropriate for the data. Round all calculations to the nearest hundredth. 2. What is the growth factor per minute? Round your answer to the nearest hundredth. 3. Find an exponential model for the pulse rate P as a function of the number of minutes t of exercise. Since the ratios of successive pulse rates are approximately equal, the data can be modeled with an exponential function. The growth factor per minute is approximately 1.12. The exponential model for the data is still where P = pulse rate and t = number of minutes of exercise. 4. Based on the model, what would be the pulse rate after 6 minutes? The pulse rate after 6 minutes would be about 118 BPM.
The average pulse rate of a man at rest is 60 beats per minute (BPM). The chart shows the average pulse rate of a man every 3 minutes after he begins exercising. 1. Show that an exponential model would be appropriate for the data. Round all calculations to the nearest hundredth. 2. What is the growth factor per minute? Round your answer to the nearest hundredth. Since the ratios of successive pulse rates are approximately equal, the data can be modeled with an exponential function. To answer question 2, we must convert from a growth rate every 3 minutes to a growth rate per minute. To do this we will perform what is known as a unit conversion.
Unit Conversion in an exponential function Performing a unit conversion from larger to smaller units. Suppose you have the exponential function y = 3500( ), where t represents years and you want to find the monthly growth rate. • Identify the yearly growth factor. • Raise the yearly growth factor to the power. • This number is the monthly growth factor. • Identify the monthly growth rate. • Rewrite the function using the new growth factor. Because there are 12 months in a year y = 3500( ) where t = months
The average pulse rate of a man at rest is 60 beats per minute (BPM). The chart shows the average pulse rate of a man every 3 minutes after he begins exercising. 1. Show that an exponential model would be appropriate for the data. Round all calculations to the nearest hundredth. 2. What is the growth factor per minute? Round your answer to the nearest hundredth. 3. Find an exponential model for the pulse rate P as a function of the number of minutes t of exercise. Since the ratios of successive pulse rates are approximately equal, the data can be modeled with an exponential function. The growth factor per minute is approximately 1.12. The exponential model for the data is still where P = pulse rate and t = number of minutes of exercise.
Now let’s look at Exercise 4 in Section 4.1 • The exponential function N = 3500 x 1.77d, where d is measured in decades, gives the number of individuals in a certain population. • Calculate N(1.5) and explain what your answer means. • What is the percentage growth rate per decade? • What is the yearly growth factor rounded to three decimal places? What is the yearly percentage growth rate? N(1.5) = 8242 is the number of individuals 15 years later. 77% 1.059 5.9% d. Rewrite the function using the new growth factor. N = 3500 x 1.059t where t = years
Modeling exponential data • To test whether data with evenly spaced values for the variable show exponential growth or decay, calculate successive quotients. If the quotients are all (approximately) the same, it is appropriate to model the data with an exponential function. If the quotients are not all about the same, some other model will be needed. • To model exponential data, use the common successive quotient for the growth (or decay) factor if the data are measured in 1-unit increments. If they are not, a unit conversion will be necessary.
Unit Conversion in an exponential function Performing a unit conversion from smaller to larger units. Suppose you have the exponential function y = 8250( ), where t is the # of months, and you want to find the yearly growth rate. • Identify the monthly growth factor. • Raise the monthly growth factor to the 12th power. • This number is the yearly growth factor. • Identify the yearly growth rate. • Rewrite the function using the new growth factor. Because there are 12 months in a year. y = 8250( ) where t = years
Homework: Read Section 4.2 (up through bottom Page 334) Page 339 # S-8, S-10 Pages 340 – 343 # 1, 2, 4, 14