Efficient Data Flow Diagram Development Guide
720 likes | 907 Views
Learn the rules for creating detailed data flow diagrams for effective visualization and organization of processes. Follow step-by-step guidelines, label data flows, group related flows, and organize processes logically. Perfect your diagrams through iterations for clarity and coherence. Include process numbers, action verbs in process names, label data stores, and maintain proper flow direction. Ensure neatness with no crossing lines on the final copy.

Efficient Data Flow Diagram Development Guide
E N D
Presentation Transcript
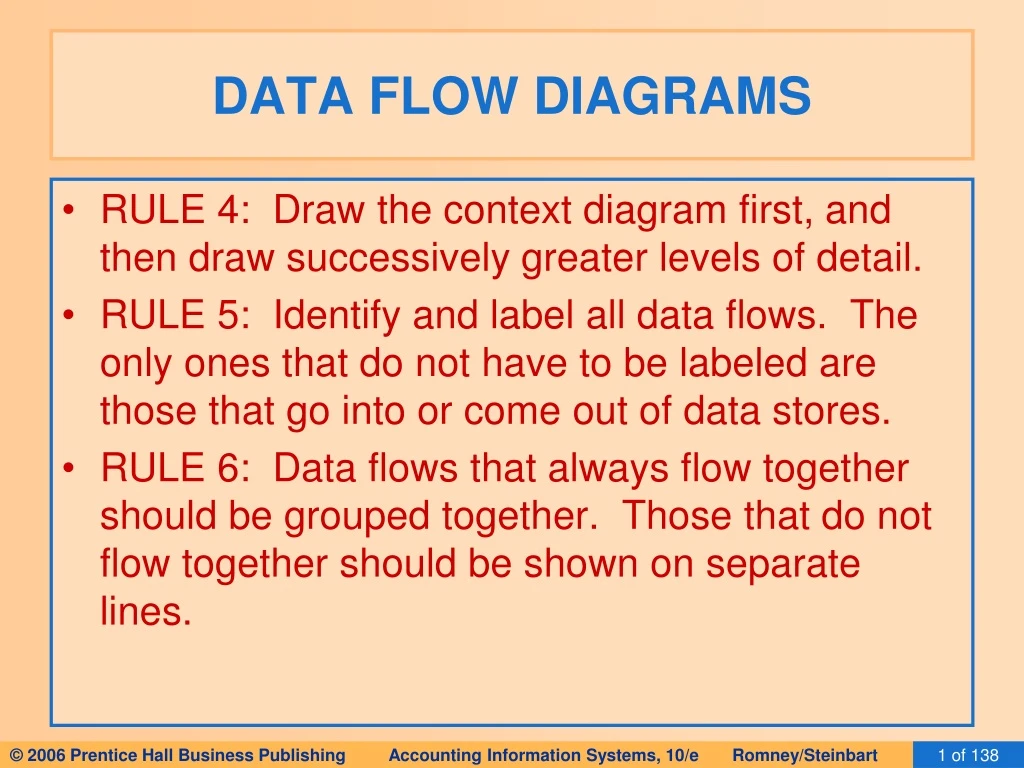
DATA FLOW DIAGRAMS • RULE 4: Draw the context diagram first, and then draw successively greater levels of detail. • RULE 5: Identify and label all data flows. The only ones that do not have to be labeled are those that go into or come out of data stores. • RULE 6: Data flows that always flow together should be grouped together. Those that do not flow together should be shown on separate lines.
DATA FLOW DIAGRAMS • RULE 7: Show a process (circle) wherever a data flow is converted from one form to another. Likewise, every process should have at least one incoming data flow and at least one outgoing data flow. • RULE 8: Transformation processes that are logically related or occur simultaneously can be grouped in one bubble. • RULE 9: Number each process sequentially. A process labeled 5.0 would be exploded at the next level into processes numbered 5.1, 5.2, etc. A process labeled 5.2 would be exploded into 5.21, 5.22, etc.
DATA FLOW DIAGRAMS • RULE 10: Process names should include action verbs, such as update, prepare, etc. • RULE 11: Identify and label all data stores, whether temporary or permanent. • RULE 12: Identify and label all sources and destinations. An entity can be both a source and destination. You may wish to include such items twice on the diagram, if needed, to avoid excessive or crossing lines.
DATA FLOW DIAGRAMS • RULE 13: As much as possible, organize the flow from top to bottom and left to right. • RULE 14: You’re not likely to get it beautiful the first time, so plan to go through several iterations of refinements. • RULE 15: On the final copy, lines should not cross. On each page, include: • The name of the DFD • The date prepared • The preparer’s name
DATA FLOW DIAGRAMS • Now that we’ve been through the guidelines for developing DFDs, let’s go back to the chapter example and see if we can re-create a part of it. • You may wish to create a table with the following headings to organize your information: • Data Inputs • Processes • Data Outputs
DATA FLOW DIAGRAMS • The first paragraph of the narrative for the payroll process reads as follows: • When employees are hired, they complete a new employee form. When a change to an employee’s payroll status occurs, such as a raise or a change in the number of exemptions, human resources completes an employee change form. A copy of these forms is sent to payroll. These forms are used to create or update the records in the employee/payroll file and are then stored in the file. Employee records are stored alphabetically.
DATA FLOW DIAGRAMS • The first paragraph of the narrative for the payroll process reads as follows: • When employees are hired, they complete a new employee form. When a change to an employee’s payroll status occurs, such as a raise or a change in the number of exemptions, human resources completes an employee change form. A copy of these forms is sent to payroll. These forms are used to create or update the records in the employee/payroll file and are then stored in the file. Employee records are stored alphabetically. The portion marked in red relates to activities that go on outside the boundaries of the payroll system. Consequently, these activities will not be included on the DFD.
DATA FLOW DIAGRAMS • The first paragraph of the narrative for the payroll process reads as follows: • When employees are hired, they complete a new employee form. When a change to an employee’s payroll status occurs, such as a raise or a change in the number of exemptions, human resources completes an employee change form. A copy of these forms is sent to payroll. These forms are used to create or update the records in the employee/payroll file and are then stored in the file. Employee records are stored alphabetically. The portion marked in red suggests two data flows coming into the payroll process (new employee forms and employee change forms). The source of the inflows is the human resources department.
DATA FLOW DIAGRAMS • The first paragraph of the narrative for the payroll process reads as follows: • When employees are hired, they complete a new employee form. When a change to an employee’s payroll status occurs, such as a raise or a change in the number of exemptions, human resources completes an employee change form. A copy of these forms is sent to payroll. These forms are used to create or update the records in the employee/payroll file and are then stored in the file. Employee records are stored alphabetically. The sentence marked in red suggests a process (update employee records) with the data outflow going to a data store (the employee/payroll file).
DATA FLOW DIAGRAMS • The first paragraph of the narrative for the payroll process reads as follows: • When employees are hired, they complete a new employee form. When a change to an employee’s payroll status occurs, such as a raise or a change in the number of exemptions, human resources completes an employee change form. A copy of these forms is sent to payroll. These forms are used to create or update the records in the employee/payroll file and are then stored in the file. Employee records are stored alphabetically. The final sentence in this paragraph provides information about the physical storage of the data. Physical information is utilized in flowcharts but not in data flow diagrams.
DATA FLOW DIAGRAMS We will not do the entire DFD, however, you could finish this table by reading the remainder of the narrative in Table 3-1 in your textbook. The portion of the table completed so far allows us to draw the segment of the DFD that is highlighted on the following slide.
General Ledger DATA FLOW DIAGRAMS Depart- ments Employees Employee paychecks Human Resources New employee form Time cards 1.0 Update empl. Payroll file 2.0 Pay Employ- ees Employee Change form Payroll check Bank Payroll Disburse- ment data 3.0 Prepare reports 5.0 Update Gen. Ledger Employee/ Payroll file Payroll tax disb. voucher Payroll report 4.0 Pay taxes Manage- ment Tax report & payment Govt. Agencies
DATA FLOW DIAGRAMS • Keep the following in mind as you develop your DFD: • Remember to ignore control activities, such as error correction processes. • Some data inputs and outputs will not appear on the first level of the DFD but appear as the processes are exploded into greater levels of detail.
DATA FLOW DIAGRAMS • The data flow diagram focuses on the logical flow of data. • Next, we will discuss flowcharts, which place greater emphasis on physical details.
FLOWCHARTS • A flowchart is an analytical technique that describes some aspect of an information system in a clear, concise, and logical manner. • Flowcharts use a set of standard symbols to depict processing procedures and the flow of data.
FLOWCHARTS • Every shape on a flowchart depicts a unique operation, input, processing activity, or storage medium. • In the days of yore, flowcharts were commonly drawn with templates. • Now, it is more common to use a software program such as Visio. • Microsoft and Power Point are also used • The software uses pre-drawn shapes, and the developer drags the shapes into the drawing.
FLOWCHARTS • There are four types of flowcharting symbols: • Input/output symbols Input/output symbols indicate the type of device or media that provides input to or records output from a process.
FLOWCHARTS • There are four types of flowcharting symbols: • Input/output symbols • Processing symbols Processing symbols indicate the type of device used to process the data or whether the data is processed manually.
FLOWCHARTS • There are four types of flowcharting symbols: • Input/output symbols • Processing symbols • Storage symbols Storage symbols indicate the type of device used to store data while the system is not using it.
FLOWCHARTS • There are four types of flowcharting symbols: • Input/output symbols • Processing symbols • Storage symbols • Flow and miscellaneous symbols • Flow and miscellaneous symbols may indicate: • The flow of data and goods • The beginning or end of the flowchart • The location of a decision • An explanatory note
FLOWCHARTS • Click on buttons below if you wish to review symbols in the various categories. Input/Output Symbols Processing Symbols Storage Symbols Flow & Misc. Symbols
DOCUMENT FLOWCHARTS • A document flowchart shows the flow of documents and information among areas of responsibility in an organization. • These flowcharts trace a document from cradle to grave and show: • Where a document comes from • Where it’s distributed • How it’s used • It’s ultimate disposition • Everything that happens as it flows through the system
DOCUMENT FLOWCHARTS • Internal control flowcharts are document flowcharts used to evaluate the adequacy of internal controls, such as segregation of duties or internal checks. • They can reveal weaknesses or inefficiences such as: • Inadequate communication flows • Unnecessarily complex document flows • Procedures that cause wasteful delays • Document flowcharts are also prepared in the system design process.
This is part of the document flowchart from Figure 3-9 in your textbook.
GUIDELINES FOR PREPARING FLOWCHARTS • Let’s step through some guidelines for preparing flowcharts: • As with DFDs, you can’t effectively prepare a flowchart if you don’t understand the system, so: • Interview users, developers, auditors, and management. • Administer questionnaires. • Read through narratives. • Walk through systems transactions
GUIDELINES FOR PREPARING FLOWCHARTS • Identify: • Entities to be flowcharted, e.g., departments, functions, external parties (the parties who “do” things in the story) • Documents or information flows • Processes • As you read through a narrative, you may want to mark the preceding items with different shapes (e.g., drawing a rectangle around entities, circling documents, etc.).
GUIDELINES FOR PREPARING FLOWCHARTS • Use separate columns for the activity of each entity. • Example: If there are three different departments or functions that “do” things in the narrative, there would be three columns on the flowchart.
GUIDELINES FOR PREPARING FLOWCHARTS • Flowchart the normal course of operations, and identify exceptions with annotations. • As much as possible, the flow should go from top to bottom and left to right. • Use standard flowcharting symbols, and draw with a template or computer. • Clearly label all symbols. Use annotations if necessary to provide adequate explanation.
GUIDELINES FOR PREPARING FLOWCHARTS • Give the flowchart a clear beginning and ending. • Show where each document originated and its final disposition. • One approach you can use is to read through the narrative and for each step define: • What was (were) the input(s) • What process was carried out • What was (were) the output(s) • Note on the next slide that the flow sequence is input -- process – output.
Output to storage
Input for next process
GUIDELINES FOR PREPARING FLOWCHARTS • Every manual process should have at least one input and at least one output. • Show all data entered into or retrieved from a computer file as passing through a process first. • Do not show process symbols for: • Forwarding a document to another entity • Filing a document
Forwarding a document
Filing a document
GUIDELINES FOR PREPARING FLOWCHARTS • Do not connect two documents except when forwarding to another column. • When a document is forwarded, show it in both locations.
GUIDELINES FOR PREPARING FLOWCHARTS • When using multiple copies of a document, place document numbers in the upper, right-hand corner.
What happens to the document numbers as the documents move to other locations?
GUIDELINES FOR PREPARING FLOWCHARTS • Show on-page connectors and label them clearly to avoid excess flow lines.
GUIDELINES FOR PREPARING FLOWCHARTS • Use off-page connectors if the flow goes to another page.