1 / 1

Genetic Distance and LD Decay in European Barley Cultivars

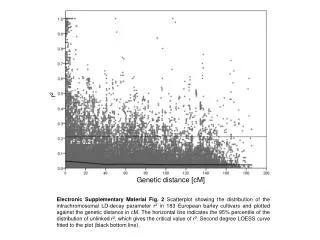
Scatterplot of LD decay parameter r2 distribution in 183 European barley cultivars plotted against genetic distance in cM. The 95th percentile of unlinked r2 distribution marks the critical value. Second-degree LOESS curve is fitted to the plot.

Download Presentation

Genetic Distance and LD Decay in European Barley Cultivars

An Image/Link below is provided (as is) to download presentation Download Policy: Content on the Website is provided to you AS IS for your information and personal use and may not be sold / licensed / shared on other websites without getting consent from its author. Content is provided to you AS IS for your information and personal use only. Download presentation by click this link. While downloading, if for some reason you are not able to download a presentation, the publisher may have deleted the file from their server. During download, if you can't get a presentation, the file might be deleted by the publisher.

E N D

Presentation Transcript


  1. r2 r2 = 0.21 Genetic distance [cM] Electronic Supplementary Material Fig. 2 Scatterplot showing the distribution of the intrachromosomal LD-decay parameter r2 in 183 European barley cultivars and plotted against the genetic distance in cM. The horizontal line indicates the 95% percentile of the distribution of unlinked r2, which gives the critical value of r2. Second degree LOESS curve fitted to the plot (black bottom line).

More Related