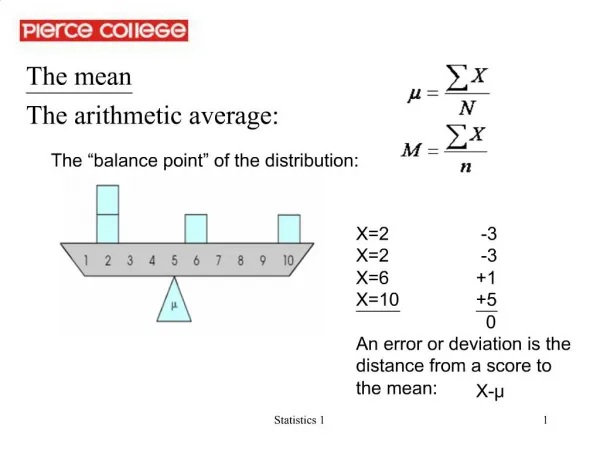
The mean The arithmetic average:
Statistics 1. 2. . The sum of the errors or deviations around the mean is always 0.Advantage: More informative than median

The mean The arithmetic average:
E N D
Presentation Transcript
1. Statistics 1 1 The mean
The arithmetic average:
2. Statistics 1 2 The sum of the errors or deviations around the mean is always 0.
Advantage: More informative than median & mode
Takes all the observation/scores into account.
Takes the distance & direction of deviations/errors into account.
3. Statistics 1 3 Advantage: More uses than median & mode
Necessary for calculating many inferential statistics.
Limitation: Not always possible to calculate a mean (scale)
Mean can only be calculated for interval/ratio level data
Need a different measure for nominal or ordinal level data
4. Statistics 1 4 Limitation: Not always appropriate to use the mean to describe the middle of a distribution (distribution)
Mean is sensitive to extreme values or �outliers�
Mean does not always reflect where the scores �pile up�
Need a different measure for asymmetrical distributions
Use the mean for unimodal, symmetrical distributions of interval/ratio level data.
5. Statistics 1 5 The median
Divides the distribution exactly in half; 50th percentile
Odd # of scores & no �pileup� or ties at the middle:
median = the middle score
6. Statistics 1 6 Even # of scores & no �pileup� or ties at the middle:
median = the average of the 2 middle scores
7. Statistics 1 7 Advantage: Insensitive to extreme values
Can be used when extreme values distort the mean
3, 5, 5, 6, 7, 8, 9 median=6 mean= 6.1
3, 5, 5, 6, 7, 8, 50 median=6 mean=12
Is the most central, representative value in skewed distributions
Advantage: Can be calculated when the mean cannot
Can be used with ranks (as well as interval/ratio data)
Can be used with open-ended distributions
Example: # of siblings (5+ siblings?)
8. Statistics 1 8 Limitation: Not as informative as the mean
Takes only the observations/scores around the 50th %ile into account.
Provides no information about distances between observations.
Limitation: Fewer uses than the mean
Median is purely descriptive.
9. Statistics 1 9 Limitation: Not always possible to calculate a median (scale)
Median can only be calculated for ordinal & interval/ratio data
Use the median when you cannot calculate a mean or when the distributions of interval/ratio data are skewed by extreme values.
10. Statistics 1 10 The mode
The most frequently occurring score(s)
Advantage: Simple to find
11. Statistics 1 11 Advantage: Can be used with any scale of measurement
Median can only be calculated for ordinal & interval/ratio data
Mean can only be calculated for interval/ratio data
Advantage: Can be used to indicate >1 most frequent value
Use to indicate bimodality, multimodality
12. Statistics 1 12
13. Statistics 1 13
14. Statistics 1 14 Limitation: Not as informative as the mean or median
Takes only the most frequently observed X values into account.
Provides no information about distances between observations or the # of observations above/below the mode.
Limitation: Fewer uses than the mean
Mode is purely descriptive.
Need to calculate a mean to use with inferential statistics.
Use the mode when you cannot compute a mean or median, or with the mean/median to describe a bimodal/multimodal distribution.
15. Statistics 1 15 Describing distributions: Measures of variability or dispersion
To describe/summarize a distribution of scores efficiently, you need:
A measure of central tendency + a measure of variability.
Which measure of central tendency is most appropriate? Why?
16. Statistics 1 16 Central tendency & variability measures are �partners.�
Mode ?range
Median ?interquartile range, semi-interquartile range
Mean ?SS, variance (s�or s� ), standard deviation (s or s)
These measures describe distributions & indicate how well individual scores or samples of scores represent the population.
17. Statistics 1 17 Variability measures used with the mode & median
Range
Based on the distance between the highest & lowest observations on the X scale.
Only takes the 2 most extreme observations into account.
18. Statistics 1 18 For interval/ratio data, range =
19. Statistics 1 19 Range can also be used for ordered categories:
Range = from �agree� to �disagree strongly,� with modal response = �disagree.�
The range is typically used with the mode, when the mean & median are inappropriate or impossible to calculate (but may be reported along with a median or a mean).
20. Statistics 1 20 Interquartile range (IQR) & semi-interquartile range (SIQR)
Based on distances between scores corresponding to percentiles on the X scale.
Only take the middle 50% of the distribution into account.
Use only with interval/ratio data.
Interquartile range = distance between 1st & 3rd quartiles
IQR = Q3 - Q1
1st quartile [Q1] is the score at the 25th percentile
2nd quartile [Q2] is the score at the 50th percentile�the median
3rd quartile [Q3] is the score at the 75th percentile
21. Statistics 1 21 IQR provides information about how much distance on the X scale covers or contains the middle 50% of the distribution.
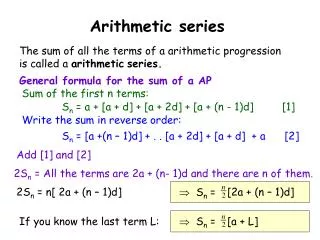
22. Statistics 1 22 N=
Q1=
Q3=
IQR=
SIQR =
Semi-Interquartile range = half the interquartile range
SIQR =
For a symmetrical distribution, SIQR tells you the distance from the median up to Q3 or down to Q1�the distance covering the 25% of the distribution to each side of the median.
The interquartile range & semi-interquartile range are typically used with the median (but may be reported along with a mean).
23. Statistics 1 23 Variability measures used with the mean
SS, variance & standard deviation are based on distances between each of the scores & the mean on the X scale.
All scores are taken into account, as with the mean.
Use only with interval/ratio data.
Most useful for symmetrical distributions, when the mean is the best measure of central tendency.
24. Statistics 1 24
25. Statistics 1 25 Suppose you want to summarize how far the scores in a distribution typically deviate from the mean.
Averages are a convenient way to summarize information, BUT:
REMEMBER: An error or deviation is the distance from a score to the mean:
X- �
REMEMBER: The sum of the deviations around the mean is always 0.
26. Statistics 1 26 You can�t sum the deviations & divide by the number of scores to get a useful average amount of deviation: 0/N will always = 0.
What can you do to summarize the deviations?
27. Statistics 1 27 Computing, squaring, & summing all N deviations is tedious, so there is a �shortcut.�
Plug these values into the following formula:
(computational formula�use this one)
For the distribution of N=4,
?X= 8 ?X�= 38
28. Statistics 1 28 Computing, squaring, & summing all N deviations is tedious, so there is a �shortcut.�
Plug these values into the following formula:
(computational formula�use this one)
For the distribution of N=4,
?X= 8 ?X�= 38
SS=
29. Statistics 1 29 So, what does __ tell you about the variability of the distribution of scores?
By itself, not much�
SS summarizes the amount of deviation & is useful for further analyses.
In general, we CAN say that:
30. Statistics 1 30 As variability increases (more differences between scores, larger deviations) SS gets larger.
Extreme scores farther from � contribute proportionately more to SS because they produce larger deviations.
As N increases (more squared deviations to sum) SS gets larger.
Because SS increases with N, SS is NOT a good descriptive statistic
You can�t compare SS between groups of different sizes.
31. Statistics 1 31 How can you use SS to create a measure that will allow you to compare different-sized groups?
32. Statistics 1 32 How can you use SS to create a measure that will allow you to compare different-sized groups?
Variance = the average squared deviation or �mean squared deviation�
Variance is not affected by N, because it is an average�the mean squared deviation.
Variance summarizes the amount of deviation, allows for comparisons between different-sized groups, & is useful for further analyses.
Since variance is a mean of squared deviations, it is not on the same scale as our original variable
33. Statistics 1 33 Because variance does NOT allow you to describe typical variation among scores in terms of the original scale, it is still NOT a good descriptive statistic.
The relationship between variance & distances or units on the I/E scale is difficult to visualize or understand.
How can you use ?� to create a descriptive measure of variability on the same scale as the original scores?
SS=the sum of the squared deviations = ?(X-?)�
?�=the average squared deviation = SS/N
What we�d really like to have is a measure of the typical or average deviation from the mean that is NOT based on squared quantities.
34. Statistics 1 34 Standard deviation = the typical or expected deviation
The typical, average, or �expected� distance that scores deviate from the mean.
population s.d.
Taking the square root of the variance �returns� the measure of variability to the original units of measurement.
This allows you to represent standard deviation as a distance on the X axis.
This also allows you to make statements about how extreme or unusual an observation is.
35. Statistics 1 35 Note: As with the mean, standard deviation is most useful for describing symmetrical distributions.
Standard deviation is the best descriptive measure of variability around a mean; SS & variance are important concepts for understanding & for use in further analyses.
36. Statistics 1 36 Sample variance & standard deviation
We often want to make statements about population parameters.
How extroverted are male U.S. citizens, on average?
Parameter of interest = � .
BUT, much of the time we only have access to sample statistics.
How extroverted are males from the PSY 1 subject pool, on average?
Our best estimate of � = M calculated using sample data.
37. Statistics 1 37
38. Statistics 1 38 Formulae
39. Statistics 1 39 Sample & population SS are the same
Calculations do NOT change from population to sample.
Population: Sample:
�N� has just been relabeled as �n.�
If you use the definitional formula, use the correct mean.
Population: Sample:
This will matter later on�
40. Statistics 1 40 Comparing sample & population variances
Calculations DO change from population to sample.
Population: Sample:
�N� has been relabeled as �n.�
AND
Use n-1 instead of N in the denominator.
Sample formula will always yield a larger value.
41. Statistics 1 41 Why (n-1) instead of N?
Because (n-1) instead of N corrects for bias in calculating s & s�.
Remember: Sample statistics are only useful to the extent that they provide unbiased estimates of population parameters.
What is an unbiased statistic?
42. Statistics 1 42 One that on average = the population parameter.
M is an unbiased estimate of ?: The average of many sample means = the population mean.
43. Statistics 1 43 SS/N tends to underestimate population variance when using sample data.
Why doesn�t the SS/N formula work with sample data?
Samples usually contain less variability than the populations they come from.
44. Statistics 1 44 Dividing SS by a smaller number corrects for the tendency to underestimate true population variability.
The n-1 correction makes s� & s unbiased estimators of s� & s .
n-1 is also referred to as �degrees of freedom.�
Sample variances have n-1 degrees of freedom�they are calculated from n-1 independent scores.
The last score is determined by the other scores & by M.
45. Statistics 1 45 For the following set of data, compute the value for SS.
Scores: 5, 2, 2, 7, 9
ANS: SS =
Calculate the variance and the standard deviation for the following date (Population & Sample)
Scores: 2, 3, 2, 4, 7, 5, 3, 6, 4
46. Statistics 1 46 Data: