Into a warming world
Into a warming world. UNEP. WMO. R K Pachauri Chairman, IPCC Director-General, TERI State of the World Symposium Washington 15 th January 2009. The Intergovernmental panel on climate change: Science at the service of policy-making. Experts review the first draft of the report

Into a warming world
E N D
Presentation Transcript
Into a warming world UNEP WMO R K Pachauri Chairman, IPCC Director-General, TERI State of the World Symposium Washington 15th January 2009
The Intergovernmental panel on climate change: Science at the service of policy-making
Experts review the first draft of the report Governments and experts review the second draft of the report and the draft Summary for Policymakers Governments review word-by-word the revised draft Summary for Policymakers Writing and review process of the IPCC assessment reports
+2500 scientific expert reviewers 800 contributing authors 450 lead authors +130 countries The IPCC Fourth Assessment Report (2007)
References to the IPCC Fourth Assessment Report in the Bali Action Plan (December 2007) “Responding to the findings of the Fourth Assessment Report of the Intergovernmental Panel on Climate Change that warming of the climate system is unequivocal, and thatdelay in reducing emissions significantly constrains opportunities to achieve lower stabilization levels and increases the risk of more severe climate change impacts” “[…] emphasizing the urgency to address climate change as indicated in the Fourth Assessment Report of the Intergovernmental Panel on Climate Change” “[…] urgent and immediate needs of developing countries that are particularly vulnerable to the adverse effects of climate change, especially the least developed countries and small island developing States, and further taking into account the needs of countries in Africa affected by drought, desertification and floods”
Key findings of the IPCC Fourth Assessment Report: 1. “Warming of the climate system is unequivocal”
Observed changes Global average temperature Global average sea level Northern hemisphere snow cover
Models using only natural forcing Models using both natural and anthropogenic forcing Observations Global temperature change 1 0.5 0 Temperature anomaly 1900 1950 2000 Year
The frequency of heavy precipitation events has increased over most land areas Rainfall in Mumbai (India), 2005: 1 million people lost their homes
Heat waves have become more frequent over most land areas - Heat wave in Europe, 2003: 35 000 deaths
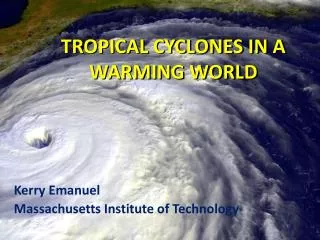
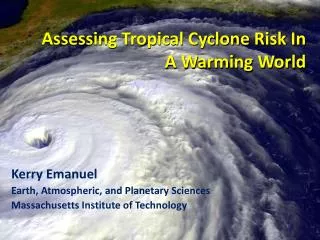
Intense tropical cyclone activity has increased • in the North Atlantic since about 1970 - Hurricane Katrina, 2005: up to $200 billion cost estimate
More intense and longer droughts have been observed over wider areas since the 1970s, particularly in the tropics and subtropics Photo credit: GoodPlanet
Key findings of the IPCC Fourth Assessment Report: 2. “Continued GHG emissions [...] would induce many changes in the global climate system during the 21st century that would very likely be larger than those observed during the 20th century”
-2 Carbon Dioxide (ppm) Radiative Forcing (Wm ) 10000 5000 0 Time (before 2005) Carbon dioxide emissions Global atmospheric concentrations of greenhouse gases (GHG) increased markedly as a result of human activities, with an increase of 70% in 1970-2004 U.S. emissions have risen by 14.7% in 1990-2006* *Source: EPA, 2008
Projected surface temperature changes (2090-2099 relative to 1980-1999) (oC) 0 0.5 1 1.5 2 2.5 3 3.5 4 4.5 5 5.5 6 6.5 7 7.5 Continued emissions would lead to further warming of 1.1ºC to 6.4ºC over the 21st century
Examples of impacts associated with global average temperature change relative to 1980-1999
Warming in western mountains is projected to cause decreased snowpack and reduced summer flows, exacerbating competition for over-allocated water resources Increased number, intensity and duration of heatwaves will have potential for adverse health impacts Coastal communities and habitats will be increasingly stressed by climate change impacts interacting with development and pollution Impacts on North America
People exposed to increased water stress by 2020: • 120 million to 1.2 billion in Asia • 12 to 81 million in Latin America • 75 to 250 million in Africa Possible yield reduction in agriculture: • 30% by 2050 in Central and South Asia • 30% by 2080 in Latin America • 50% by 2020 in some African countries Crop revenues could fall by 90% by 2100 in Africa Expected impacts on poor regions
Key findings of the IPCC Fourth Assessment Report: 3. “Neither adaptation nor mitigation alone can avoid all climate change impacts; however, they can complement each other and together can significantly reduce the risks of climate change”
Global mean temp. increase (ºC) Stabilization level (ppm CO2-eq) Year CO2 needs to peak 2.0 – 2.4 445 – 490 2000 – 2015 2.4 – 2.8 490 – 535 2000 – 2020 2.8 – 3.2 535 – 590 2010 – 2030 3.2 – 4.0 590 – 710 2020 – 2060 Stabilisation scenarios
Costs of mitigation in 2030 Mitigation measures would induce 0.6% gain to 3% decrease of GDP in 2030
Cost of mitigation in 2030: max 3% of global GDP GDP without mitigation GDP with stringent mitigation Mitigation would postpone GDP growth by one year at most over the medium term Impacts of mitigation on GDP growth (for stabilisation scenario of 445-535 ppm CO2-eq) GDP Current Time 2030 Schematic graph
Co-benefits of mitigation • Healthco-benefits from reduced air pollution • Increased energysecurity • More rural employment • Increased agriculturalproduction and reduced pressure on natural ecosystems Co-benefits provide the opportunity for no-regrets policies and reduce mitigation costs
Key findings of the IPCC Fourth Assessment Report: 4. “There is substantial […] potential for the mitigation of global GHG emissions over the coming decades that could […] reduce emissions below current levels”
All stabilisation levels assessed can be achieved by deployment of a portfolio of technologies that are currently available or expected to be commercialised in coming decades This assumes appropriate and effective incentives are in place for their development, acquisition, deployment and diffusion
Key mitigation instruments, policies & practices Research, development and demonstration Appropriate energy infrastructure investments Regulations and standards Taxes and charges Change in lifestyles & consumption patterns Effective carbon-price signal
BarackObama’s • New Energy for America plan (2008) • Create 5 million new green jobs by investing • $150 billion over the next 10 years • Ensure 10% of electricity comes from renewable sources by 2012, and 25% by 2025 • Get 1 million hybrid cars on the road by 2015 • Implement an economy-wide cap-and-trade program to reduce greenhouse gas emissions 80% by 2050
The need for US involvement US action on mitigation would: • enable the achievement of global stabilisation targets • ensure US competitiveness in a world market dominated by low-carbon products • re-establish confidence in US leadership on critical global issues
Man did not weave the web of life, he is merely a strand in it. Whatever he does to the web, he does to himself. Chief Seattle, 1854