Download

1 / 28
420 likes | 985 Views
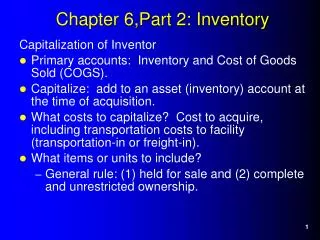
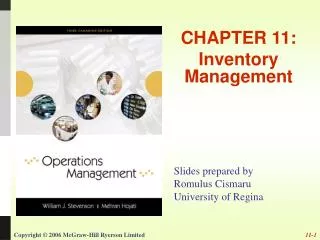
CHAPTER 6 Inventory Management. Purposes of Inventory. Enables the firm to achieve economies of scale Balances supply and demand Enables specialization in manufacturing Provides protection from uncertainties in demand and order cycle

E N D
CHAPTER 6 Inventory Management
Purposes of Inventory • Enables the firm to achieve economies of scale • Balances supply and demand • Enables specialization in manufacturing • Provides protection from uncertainties in demand and order cycle • Acts as a buffer between critical interfaces within the supply chain
Types of Inventory • Cycle Stock: inventory that results from replenishment process and is required in order to meet demand under conditions of certainty. • In-Transit Inventories: items that are en route from one location to another. • Safety or Buffer Stock: inventory held in excess of cycle stock because of uncertainty in demand or lead time.
Speculative Stock: inventory held for reasons other than satisfying current demand (e.g., quantity discounts, protect against materials shortage or expected price increase) • Seasonal Stock: inventory held before season begins; e.g., to allow a stable labor force and production runs • Dead Stock: items for which no demand has occurred for some specified period of time
Inventory Management Under Conditions of Certainty • Fixed order point, fixed order quantity model • Assume firm has average daily sales of 20 units and an order lead time of 10 days • Assume further that the firm has determined its optimal order quantity to be 600 units • The Reorder Point for the firm is daily demand x lead time (or demand during lead time) = 200 units • The firm’s average inventory level is 300 units
C . O r d e r q u a n t i t y o f 6 0 0 u n i t s I n v e n t o r y 6 0 0 O r d e r a r r i v a l A v e r a g e O r d e r c y c l e p l a c e d i n v e n t o r y 3 0 0 0 1 0 2 0 3 0 4 0 5 0 6 0 D a y s c 6-3 c The Effect of Reorder Quantity on Average Inventory Investment with Constant Demand and Lead Time Reorder Point 200
Determining Optimal Order Quantity:The Simple EOQ Model • Cost trade off involved includes only two costs: inventory carrying cost and ordering cost • Total annual cost = QVC/2 + PD/Q where Q = optimal order quantity P = ordering cost ($ per order) D = annual demand or usage (units) C = annual inventory carrying cost (%) V = average cost or value of one unit of inventory
2 P D C V • To determine Q, find derivative of TAC and set equal to zero; solve for Q • Q = • At Q (EOQ) annual inventory carrying cost is equal to annual ordering cost
Total cost Annual cost (dollars) L o w e s t t o t a l c o s t ( E O Q ) Inventory carrying cost Ordering cost Size of order 6-6 Cost Trade-offs to Determine the Most Economic Order Quantity
Inventory Carrying Number Ordering Total Cost of Orders Cost Order Cost 1/2 Q X C X V (D/Q) PX (D/Q) Quantity 40 120 $ 4,800 $ 500 $ 5,300 60 80 3,200 750 3,950 80 60 2,400 1,000 3,400 100 48 1,920 1,250 3,170 120 40 1,600 1,500 3,100 140 35 1,400 1,750 3,150 160 30 1,200 2,000 3,200 200 24 960 2,500 4,460 300 18 720 3,750 4,470 400 12 480 5,000 5,480 6-7 Cost Trade-offs V = $100 C = 25% P = $40 D = 4,800 units EOQ = 124 units (20 per pallet = 120)
Limitations of EOQ Model • Appropriate when demand is continuous and fairly constant (though solution is rather insensitive to small changes in input data). Otherwise, Q/2 is not average inventory level. • Assumes constant transportation costs and procurement costs that are independent of order quantity • Does not include stock out costs (because demand is known and constant)
Inventory Management Under Uncertainty • Firms handle variability of demand and lead time by carrying safety stock. • Add safety stock level to average demand during lead time to establish a new reorder point. • Determining safety stock level: • Calculate one standard deviation of demand during lead time when both demand and lead time vary. This equals 84.1% demand satisfaction level. • Use z tables (some in Table 6-6) to adjust to different service level. • Calculate fill rate using service function magnitude factor (see Table 6-8)
A . W i t h v a r i a b l e d e m a n d—25 units per day rather than 20 I n v e n t o r y 2 0 0 A v e r a g e c y c l e i n v e n t o r y { 1 0 0 A v e r a g e { i n v e n t o r y 8 1 0 2 0 3 0 4 0 S a f e t y ( 1 5 0 ) s t o c k D a y s ( 5 0 ) a 6-4 a Average Inventory Investment Under Conditions of Uncertainty
B . W i t h v a r i a b l e l e a d t i m e—order arrives two days late, on day 12 I n v e n t o r y 2 0 0 A v e r a g e c y c l e i n v e n t o r y { 1 0 0 A v e r a g e { i n v e n t o r y 10 1 2 2 0 3 0 4 0 S a f e t y ( 1 4 0 ) s t o c k D a y s ( 4 0 ) Average Inventory Investment Under Conditions of Uncertainty b 6-4 b
C . W i t h v a r i a b l e d e m a n d a n d l e a d t i m e I n v e n t o r y 2 0 0 A v e r a g e c y c l e i n v e n t o r y { 1 0 0 A v e r a g e { i n v e n t o r y 8 10 1 2 2 0 3 0 4 0 ( 2 0 0 ) S a f e t y s t o c k D a y s ( 1 0 0 ) c 6-4 c Average Inventory Investment Under Conditions of Uncertainty
Calculating Safety Stock Requirements • Determine one standard deviation of demand during lead time (sC) when both demand and lead time vary: sC = square root of [R(sS2) + S2(sR2)] where R = average replenishment cycle S = average daily sales sR = std. dev. of replenishment cycle sS = std. dev. of daily sales
Example • S = 100 sS = 20 R = 10 sR = 1.634 sC = 175 units • If we wanted service level of 98%, multiple sC by 2 = 350 units • We need additional calculations to determine the specific fill rates at these service levels. Fill rate = % of units demanded that are on hand to fill customer orders
Calculating Fill Rate • Fill Rate (FR) = 1 – (sC/EOQ)[I(K)] • I(K) = service function magnitude factor, based on desired number of standard deviations (see Table 6-8) • K (the safety factor) = safety stock/sC • Using textbook example: D = 25,000 V = $4.37 C = 32% P = $28 EOQ = 1,000 sC = 175 K = 1.6 Safety Stock at 94.5% level = 280 units (or 1.6 x sC)
FR = 1 – (175/1000) [0.0236] = 1 – 0.0041 = 0.9959 • Why is average fill rate of 99.59% so much higher than 94.5% service level? • Suppose firm wants a 95% fill rate. How much safety stock is required? Find K. Fill Rate (FR) = 1 – (sC/EOQ)[I(K)] [I(K)] = (1 – FR) (EOQ/sC) = (1-0.95) (1,000/175) = 0.2857 K is approximately equal to 0.25 Required safety stock is 175 x 0.25 or 44 units.
Adjusting EOQ for Volume Discounts(Note: we will use different approach) • Q1 = 2(rD/C) + (1 – r)Q0 where Q1 = quantity required to qualify for discount r = % price reduction with discount D = annual demand in units C = inventory carrying cost (%) Q0 = EOQ based on current price
Consider problem in textbook: D = 16,000 cases @ 25 pounds per case V = $8.00 per case P = $10 per order C = 25% Transportation options: $4/cwt or $1.00 per unit if Q< 15,000 pounds or 600 units $3.90/cwt or $0.975 per unit if 600 < Q < 1560 $3.64/cwt or $0.91per unit if Q > 1560
See Table 6-2 in textbook – need to check each discount volume • Q0 (EOQ) = 380 units with annual ordering cost of $430 + annual transportation cost of $16,340 + annual inventory carrying cost of $428 = $17,198 • Price reduction, r = ($9 - $8.91)/$9 = 1% • Q1 = 2(rD/C) + (1 – r)Q0 or Q1 = (2 x .01 x 16,000)/.25 + (1 - .01) (380) • New Q (Q1) of 1,660 has ordering cost of $100 + transportation cost of $14,580 + inventory carrying cost of $1,782 = $16,462 • Trade-offs: order cost decreased; transportation cost decreased; inventory carrying cost increased
EOQ with Incremental Replenishment(We won’t do this method – but here it is for interested students) 2 p P D C p-u V • Q0 = where, p = production or delivery rate and u = usage rate Total Cost = Carrying cost + Setup cost = ([Imax]/2)CV + DP/Q0
Derivation • Refer to Figure 6-6 • Imax = (p-u) (Q0/p) • Inventory carrying cost = (Imax/2)CV = (p-u)Q0CV/2p • Ordering cost = DP/Q0 • TC = (p-u)Q0CV/2p + DP/Q0 • dTC/Q0 = (p-u)CV/2p – DP/Q02 • Set = 0 and solve for Q • Q02 = (2DPp)/(p-u)CV = (2DP/CV) [p/(p-u)]
Fixed Order Interval Model • Used when orders must be placed at fixed time intervals (e.g., weekly, twice per month) • If demand is variable, order size will vary. • Must have protection for lead time plus next order cycle (since orders can only be placed at specific times). • Thus, more safety stock than fixed order quantity model.
Advantages of Fixed Order Interval Model • Requires only a periodic review of inventory levels • When two or more items come from the same supplier, grouping orders can yield savings in ordering, transportation, etc.
Symptoms of Poor Inventory 6-8 • Increasing numbers of back orders • Increasing dollar investment in inventory with back orders remaining constant. • High customer turnover rate. • Increasing number of orders being canceled. • Periodic lack of sufficient storage space. • Wide variance in inventory turnover among distribution centers & major inventory items. • Deteriorating relationships with SC partners. • Large quantities of obsolete items.
Improving Inventory Management • ABC analysis to identify items that should have centralized warehousing • Improved demand forecasting (e.g., group forecasting, collaborative forecasting) • Improved order processing and information systems • Reducing lead time variance (e.g., more dependable transportation service, tighter internal process control)