Download

1 / 18
180 likes | 270 Views
A Water Quality Loading Model for Tillamook Bay. Patrice A. Melancon Thanks to: Dr. David Maidment Dr. Michael Barrett Dr. Francisco Olivera Dr. Maidment’s Research Group. Outline . Introduction Problem and Objective Why use GIS? Developing the Model Using the Model

E N D
A Water Quality Loading Model for Tillamook Bay Patrice A. Melancon Thanks to: Dr. David Maidment Dr. Michael Barrett Dr. Francisco Olivera Dr. Maidment’s Research Group
Outline • Introduction • Problem and Objective • Why use GIS? • Developing the Model • Using the Model • Conclusions and Future Work
Introduction • National Estuary Program • Tillamook Bay
Problem and Objective • My work is focusing on two issues: • High Coliform loads • High Sediment loads • Developing a model that can serve as a Management Tool
Problem History • Coliform contamination: • Animals confined in winter; manure storage • Liquid and solid manure applied as fertilizer • Cow access to streams • Sediment contamination: • Largely linked to logging practices • Roads linked to frequent landslides
Why Use GIS? • Basic precept of Water Quality Modeling • Load = Flow x Concentration • Spatial Variability • ArcView’s Hydrology Function • Grids and Coverages
GIS Grid Representation • Surface divided into equal-sized cells • Each cell has a value • Value represents only one specific characteristic Bay Depth Below MSL
GIS Coverage Representation • Surface represented as polygons, lines, or points • Each record contains information on multiple characteristics
Developing the Model • ArcView Hydrology Functions Flow Direction Flow Accumulation DEM Accumulation in Streams
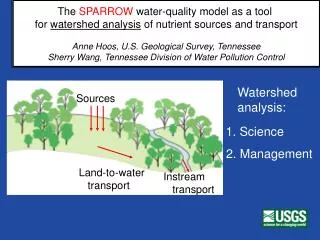
Hydrology Model Runoff + Baseflow Streamflow = Baseflow,B B Precip Flow Runoff,R R Precip
Average Annual Rainfall Precip, in
Hydrology Model RO P Runoff Grid BF Precip Grid P Baseflow Grid
Event Mean Concentrations Runoff Concentrations 0 11- 19 21 - 24 31 - 33 41 - 43 51 - 54 61 - 63 71 - 75
Pollutant Loadings • EMC grid x Flow grid = Load grid • Flow accumulations of flow and load grids • Predicted pollutant concentrations = Accumulated Load Accumulated Flow
Using the Model • Incorporate Effects of BMPs • Current focus is on CAFOs • 3 BMPs to model • Representing spatial distribution • Farm location vs land affected • Use spatial average • Analysis by subwatershed or land use
Model Analysis • Clip out subwatershed of interest • Export data to analyze BMP effects or contribution Trask River Land Use Trask River Coliform Runoff Load
Conclusions • Can build effective management tool • Effects of BMPs and relative contributions can be examined
Future Work • More work on sediment • Incorporate BMP effects • Model calibration