Download
1 / 15
150 likes | 277 Views
Explore a general method for determining the optimal number of parameters in a statistical model using the likelihood ratio test. Understand how to incorporate systematic errors and choose additional parameters for model improvement. Find the best-fit model by comparing data and model distributions. This approach helps quantify model-data agreement and determine statistical uncertainties.

E N D
Likelihood ratio test to determine bestnumber of parameters ATLAS Statistics Forum CERN, 18 February, 2009 Glen Cowan Physics Department Royal Holloway, University of London g.cowan@rhul.ac.uk www.pp.rhul.ac.uk/~cowan LR test to determine number of parameters
Introduction Present study motivated by discussions with Eilam, Stephan Horner, Sascha Caron, et al., regarding Stephan's presentation on SUSYFit at 3 December 2008 Statistics Forum. Discussions also in Top Properties meeting (16 Dec 08) and Exotics meeting (22 Jan 08). Basic idea is to develop general method for increasing number of parameters in a model; stop when fit is OK. Systematics in the original model are then included in the statistical errors of the extended model. A draft note is attached on the agenda page; also at www.pp.rhul.ac.uk/~cowan/stat/notes/plfit.pdf LR test to determine number of parameters
Determining distributions: systematics E.g. Mll distribution from Z'→dilepton search (CSC Book p 1709), uses 4-parameter function for signal. Sidebands provide estimate of background. So nothing in real analysis from MC, but... Still should consider some systematic due to fact that assumed parametric functions not perfect. LR test to determine number of parameters
A general strategy (see attached note) Suppose one needs to know the shape of a distribution. Initial model (e.g. MC) is available, but known to be imperfect. Q: How can one incorporate the systematic error arising from use of the incorrect model? A: Improve the model. That is, introduce more adjustable parameters into the model so that for some point in the enlarged parameter space it is very close to the truth. Then use profile the likelihood with respect to the additional (nuisance) parameters. The correlations with the nuisance parameters will inflate the errors in the parameters of interest. Difficulty is deciding how to introduce the additional parameters. LR test to determine number of parameters
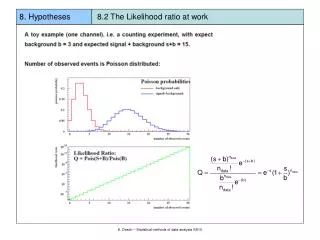
Comparing model vs. data Model number of entries ni in ith bin as ~Poisson(ni) In the example shown, the model and data clearly don't agree well. To compare, use e.g. Will follow chi-square distribution for N dof for sufficiently large ni. LR test to determine number of parameters
Model-data comparison with likelihood ratio This is very similar to a comparison based on the likelihood ratio where L(n) = P(n;n) is the likelihood and the hat indicates the ML estimator (value that maximizes the likelihood). Here easy to show that Equivalently use logarithmic variable If model correct, qn ~ chi-square for N degrees of freedom. LR test to determine number of parameters
p-values Using either c2P or qn, state level of data-model agreement by giving the p-value: the probability, under assumption of the model, of obtaining an equal or greater incompatibility with the data relative to that found with the actual data: where (in both cases) the integrand is the chi-square distribution for N degrees of freedom, LR test to determine number of parameters
A simple example True model (Nature) Data 0th order model The naive model (a) could have been e.g. from MC (here statistical errors suppressed; point is to illustrate how to incorporate systematics.) LR test to determine number of parameters
Comparison with the 0th order model The 0th order model gives qn = 258.8, p= 6 ×10-30 LR test to determine number of parameters
Enlarging the model Here try to enlarge the model by multiplying the 0th order distribution by a function s: where s(x) is a linear superposition of Bernstein basis polynomials of order m: LR test to determine number of parameters
Bernstein basis polynomials LR test to determine number of parameters
Enlarging the parameter space Using increasingly high order for the basis polynomials gives an increasingly flexible function. At each stage compare the p-value to some threshold, e.g., 0.1 or 0.2, to decide whether to include the additional parameter. Now iterate this procedure, and stop when the data do not require addition of further parameters based on the likelihood ratio test. Once the enlarged model has been found, simply include it in any further statistical procedures, and the statistical errors from the additional parameters will account for the systematic uncertainty in the original model. LR test to determine number of parameters
Fits using increasing numbers of parameters Stop here LR test to determine number of parameters
Goodness-of-fit for the extended models q compares model with npar parameters to that with npar+1 qn gives overall goodness-of-fit p-values LR test to determine number of parameters
Summary Example shown here uses a very general idea; similar philosophy applied in many analyses (cf. choosing order of a polynomial for LS fit). Example here assumes distribution can be corrected by a scale factor; need somewhat different strategy for the tail of a distribution, where MC bin contents go to zero. What to do if e.g. overall goodness-of-fit not great, but additional parameters do not help? (Tom LeCompte: F-test using ratio of chi-squares?) How to proceed if the additional parameters add too much flex- ibility, e.g., what if normalization is well known, but not, say, slope? Stephan Horner et al. have done similar things with SUSYFit (next talk). LR test to determine number of parameters