Amperometric Ethylene Sensor with Interfering Gas Trap
Amperometric Ethylene Sensor with Interfering Gas Trap Ryan Lerud* 1 , Shankar Rananavare 1 , Leonard Felix 2 , Jim Goecks 2 , Sergey Tereskchenko 2 1 Departments of Physics and Chemistry, Portland State University, OR 97207-0751; 2 CID Bio-Science, Camas, WA 98607. How the Gas Trap Operates

Amperometric Ethylene Sensor with Interfering Gas Trap
E N D
Presentation Transcript
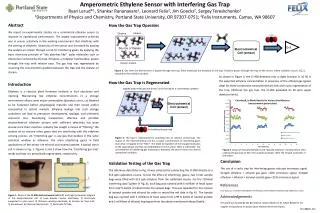
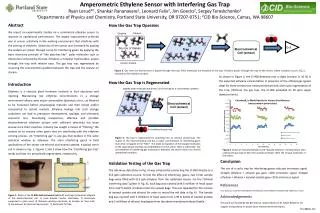
Amperometric Ethylene Sensor with Interfering Gas Trap Ryan Lerud*1, Shankar Rananavare1, Leonard Felix2, Jim Goecks2, Sergey Tereskchenko2 1Departments of Physics and Chemistry, Portland State University, OR 97207-0751; 2CID Bio-Science, Camas, WA 98607 How the Gas Trap Operates How the Gas Trap is Regenerated Validation Testing of the Gas Trap The reference data (blue in Fig. 4) was collected by connecting the CI-900 directly to a 513 ppb calibration source. To test the effect of interfering gases, two 3 liter sample bags were filled with 513 ppb ethylene from the calibrated source. For the “ethanol interfering data” (green in Fig. 4), each bag was injected with 5 milliliter of head space from a 82 % bottle of ethanol into the sample bags. This was repeated for the mixture of isoamyl acetate and ethanol (in order to record the red data in Fig. 4). The sample bag was injected with 5 milliliters of head space from a 99 % bottle of isoamyl acetate and 5 milliliters of ethanol headspace from the above mentioned ethanol bottle. Abstract We report on experimental studies on a commercial ethylene sensor to improve its operational performance. The largest improvement achieved was in sensor selectivity in the working environment that interferes with the sensing of ethylene. Selectivity of the sensor was increased by passing the analyte air stream through a trap for interfering gases. By applying the basic chemistry principle of “like dissolves like” polar molecules such as ethanol are removed by the trap. Ethylene, a nonpolar hydrocarbon, passes through the trap with relative ease. The gas trap was regenerated by reversing the concentration gradient between the trap and the analyte air stream. Introduction Ethylene is a classical plant hormone involved in fruit abscission and ripening. Maintaining low ethylene concentrations in a storage environment allows some major commodities (bananas, citrus, cut flowers) to be harvested before physiological maturity and then stored and/or transported to distant markets. Ethylene leakage into such storage containers can lead to premature development, spoilage, and ultimately economic loss. Developing inexpensive, effective and portable electrochemical ethylene sensors with sufficient selectivity has been elusive since their invention. Industry has sought a means of “filtering” the analyte air to remove other gases that are interfering with the ethylene sensing process. An “interfering gas” is any gas that oxidizes in the same potential window as ethylene. The main interfering gases in field applications of the sensor are ethanol and isoamyl acetate. A typical senor cell is shown in Fig. 1. Figures 2 and 3 show how the “interfering gas trap” works and how it is periodically regenerated, respectively. Ethanol Ethylene CO2 Source of Gases Trap Exit Electrochemical Cell (sensor) IsoamylAcetate Figure 2. Gas from the environment is passed through the trap. Polar molecules are dissolved in the trap. Ethylene passes through the trap to the sensor, where oxidation occurs. CO2 is released as the oxidation product. As shown in Figure 4, the CI-900 detected only a slight increase (< 10 %) in the expected ethylene concentration in presence of the ethanol gas (green data) for three consecutive measurement periods with cyclic regeneration of the trap. (Without the gas trap, the CI-900 exceeded its 20 ppm upper detection limit.) trapped polar molecules are driven out of the trap by a concentration gradient Trap Electrochemical Cell (sensor) for bubbling through trap Figure 3. The trap is regenerated by switching into an internal closed loop. The output of the electrochemical cell has a lower concentration of interfering gases than what is trapped in the “filter”. This leads to migration of the trapped molecules to the vapor phase and they are oxidized/burnt in the sensor. After a sufficiently low concentration of interfering gas molecules is detected, the sensor returns to normal operational condition. Figure 4. Graph of measured ethylene and “pseudo-ethylene” concentrations after utilizing the gas trap to filter the analyte airstream. Note the 10 ppb resolution of the sensor. Conclusion The use of a cyclic trap for interfering gasses reduced erroneous signal. 513ppb ethylene + ethanol gas gave <10% erroneous signal. 513ppb ethylene + ethanol + isoamyl acetate gave <25% erroneous signal. References Fruit Ripening. UC DAVIS POSTHARVEST TECHNOLOGY. POSTHARVEST HORTICULTURE SERIES No 9. 2010. Acknowledgements This work was funded by CID Bio-Science. Special thanks to Dr. Edwin Reidel for his support and guidance on proper plant measurement techniques. Figure 1. Photo of the CI-900 electrochemical cell (left) and (right) schematic diagram of the electrochemical cell. 1) Lead dioxide counter electrodes, 2) Electrolyte supported in glass wool, 3) Platinum working electrode, 4) Analyte air flow inlet, 5) Gas exhaust, 6) Electrical lead contact, 7) Electrolyte fill hole. *lerud@pdx.edu