Optimal Clustering Methods and Number of Clusters for Vegetation Classification
This study addresses the need for a systematic method to identify the optimal clustering algorithm and number of clusters in vegetation classification. The research compares various clustering methods while emphasizing ecological interpretability over purely mathematical optimization. Evaluating data from different ecological zones, including Southern Siberia and the Carpathians, it reveals that transformed cover values yield superior clustering results. The findings contribute insights into how diagnostic species can inform cluster descriptions, enhancing interpretability in phytosociological studies.

Optimal Clustering Methods and Number of Clusters for Vegetation Classification
E N D
Presentation Transcript
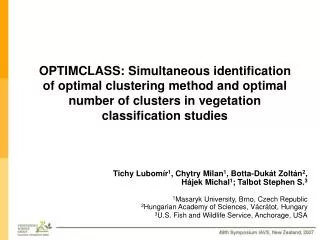
OPTIMCLASS: Simultaneous identification of optimal clustering method and optimal number of clusters in vegetation classification studies Tichy Lubomír1, Chytry Milan1, Botta-Dukát Zoltán2, Hájek Michal1; Talbot Stephen S.3 1Masaryk University, Brno, Czech Republic2Hungarian Academy of Sciences, Vácrátot, Hungary3U.S. Fish and Wildlife Service, Anchorage, USA
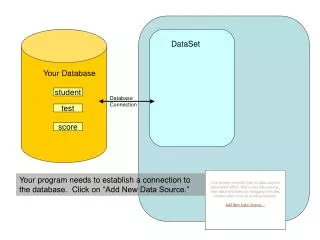
Why do we need a method for identification of optimal clustering algorithm and optimal number of clusters? The same dataset
Why do we need a method for identification of optimal clustering algorithm and optimal number of clusters? A huge variety of clustering methods produce “reasonable” results. Subjective selection of the clustering methodand no. of clustersis usually based on empirical experience Methods published: Most algorithms identify the optimal partition mathematically, without considering ecological interpretation
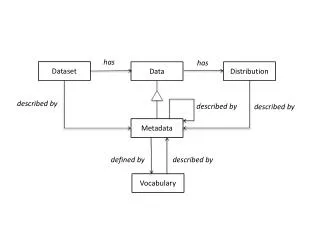
The Method Species 1 98788 12112 3.211Species 2 51123 1223. 11132Species 3 23132 ..... .....Species 4 ..2.4 112.. 1..5.Species 5 ..... .1.1. 1.213 A posteriori description of phytosociological tables is based on diagnosticspecies Diagnostic species describes a cluster. Therefore, the number of diagnostic species determines whether the classified table can be sufficiently interpreted.
The Method The samedataset:
The Method Measure of the classification quality: the total sum of diagnostic species Fisher’s Exact Test calculates the probability of observed occurrence of species across clusters for a right-tailed test hypothesis The measure reduces the importance of very small clusters. Easy interpretation: the more diagnostic species in the dataset, the better description of the clusters.
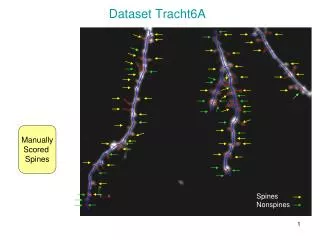
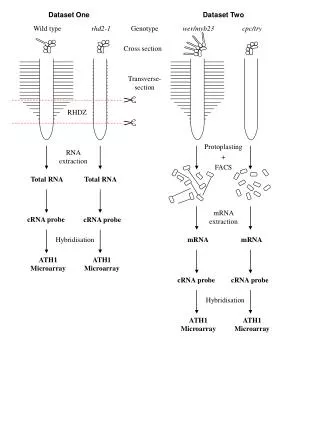
The Method Southern Siberia, Sayan Mountains (310 plots; forest, steppe and tundra vegetation) Central Europe, Carpathians (241 plots; mire vegetation) Alaska, Kenai Peninsula(171 plots; wetlands) Test on three different datasets
The Method Flexible beta clustering WARD‘s clusteringUPGMA(PC-ORD) Ordinal cluster analysis(SYN-TAX) Cover transformations (percentages, log percentages, Braun-Blanquet, presence/absence) Distance measures (Kruskal-Wallis, Kendall, Gower-Podani coefficient) Classifications tested Modified TWINSPAN classification(JUICE)The sequence of splits in divisive classification is determined by internal heterogeneity of clusters. Therefore, any number of clusters is possible (three modifications of pseudospecies cut levels) Distance measures(Bray-Curtis, Manhattan, Euclidean)
Results No. of diag. spec. No. of diag. spec. Probability = 10-3 Probability = 10-9 Sayan Mountains, Siberia (310 plots, 1036 species) No. of clusters No. of diagnostic species Probability = 10-6 No. of clusters No. of clusters
Results Number of diagnostic species Sayan Mountains, Siberia (310 plots, 1036 species) Untransformed cover data Number of clusters
Results Number of diagnostic species Sayan Mountains, Siberia (310 plots, 1036 species) Euclidean distance measure Number of clusters
Results Number of diagnostic species Sayan Mountains, Siberia (310 plots, 1036 species) Manhattan distance measure Number of clusters
Results Number of diagnostic species Sayan Mountains, Siberia (310 plots, 1036 species) Bray-Curtis distance measure Number of clusters
Results Number of diagnostic species Sayan Mountains, Siberia (310 plots, 1036 species) UPGMA Number of clusters
Results Number of diagnostic species Sayan Mountains, Siberia (310 plots, 1036 species) Ward‘s method Number of clusters
Results Number of diagnostic species Sayan Mountains, Siberia (310 plots, 1036 species) Flexible beta -0.25 Number of clusters
Results Number of diagnostic species Sayan Mountains, Siberia (310 plots, 1036 species) Ordinal cluster analyses (SYN-TAX) Number of clusters
Results Number of diagnostic species Sayan Mountains, Siberia (310 plots, 1036 species) Modified TWINSPAN Number of clusters
The Method Southern Siberia, Sayan Mountains (310 plots; forest, steppe and tundra vegetation) Central Europe, Carpathians (241 plots; mire vegetation) Alaska, Kenai Peninsula(171 plots; wetlands) Test on three different datasets Similar results:
Conclusions Classifications based on transformed cover values give better results than percentage covers. Euclidean distance - slightly poorer results than Manhattan or Bray-Curtis distances. UPGMA clustering method - poorer results than Ward’s and Flexible beta methods. No significant difference between ordinal cluster analysis proposed by Podani (SYN-TAX 2000) and other clusteringmethods. Modified TWINSPAN– performs well with small numbers of clusters.
Modified TWINSPAN classification Number of diagnostic species occurrences Number of clusters
Modified TWINSPAN classification Sum of diagnostic species Number of clusters
Modified TWINSPAN classification Number of clusters with more than 4 diagnostic species Number of clusters