Download
1 / 93
930 likes | 950 Views
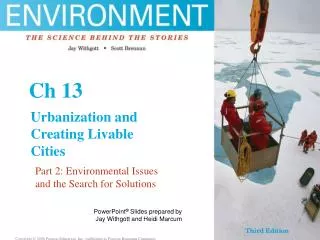
This lecture explores the nature of systems, ecosystem-level ecology, Earth's biomes, plate tectonics, the hydrologic and nutrient cycles, with a focus on the Gulf of Mexico's "Dead Zone" caused by nitrogen pollution.

E N D
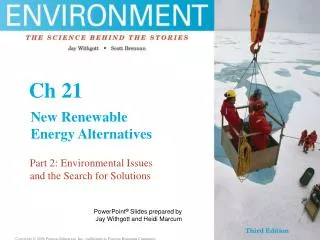
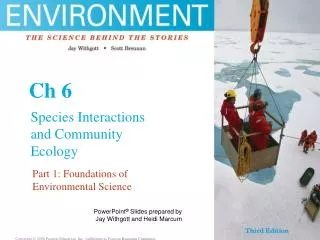
This lecture will help you understand: • The nature of systems • Ecosystem-level ecology • Earth’s biomes • Plate tectonics and the rock cycle • The hydrologic cycle • Nutrient cycles: N, C, P
Central Case: The Gulf of Mexico’s “Dead Zone” • Major fisheries off Louisiana were devastated by die-offs. • Scientists found large regions of low oxygen in the Gulf. • The recurring “dead zone” resulted from nitrogen pollution traveling down the Mississippi River.
Earth’s environmental systems Our planet consists of many complex, large-scale, interacting systems. System = a network of relationships among a group of parts, elements, or components that interact with and influence one another through the exchange of energy, matter, and/or information
Feedback loops: Negative feedback • Feedback loop = a circular process whereby a system’s output serves as input to that same system. • In a negative feedback loop, output acts as input that moves the system in the opposite direction. • This compensation stabilizes the system* Figure 6.1a
Feedback loops: Positive feedback • In a positive feedback loop, output acts as input that moves the system further in the same direction. • This magnification of effects destabilizes the system. Figure 6.1b
Dynamic equilibrium, homeostasis • Dynamic equilibrium = when processes in a system move in opposite directions at equivalent rates so their effects balance out • This can contribute to • Homeostasis = tendency of a system to maintain constant or stable internal conditions • Earth’s climate and an animal’s body are examples of homeostatic systems in dynamic equilibrium.
Emergent properties • Properties of a whole system not evident in the system’s components • “The whole is more than the sum of its parts.” • A tree is an element of a forest, a sink for CO2, and habitat for birds. Figure 6.2
Closed and open systems • Closed system = isolated and self-contained • Open system = exchanges energy, matter, and information with other systems • It is useful to think of Earth as a closed system. • But any system is open if we examine it closely enough or long enough.
An environmental system • Mississippi River as a system: • Emergent properties • Input of water, fish, pollution, etc. • Output to Gulf of Mexico Figure 6.3
Two systems or one? • The Mississippi River system and the system of the Gulf of Mexico interact. • Understanding the dead zone requires viewing the Mississippi River and the Gulf of Mexico as a single system. • This holistic kind of view is necessary for comprehending many environmental issues and processes.
Increasing nitrogen inputs Amount of nitrogen fertilizer used rose greatly, 1950-80 Nitrate concentrations in Midwestern rivers in 1980-96 were much more than in 1905-07. Figure 6.4
Eutrophication • Key to the dead zone = • Eutrophication: excess nutrient enrichment in water, which increases production of organic matter... • … which when decomposed by oxygen-using microbes can deplete water of oxygen • Excess runoff of nutrients like nitrogen and phosphorus leads to blooms of algae or phytoplankton and then microbial decay that sucks oxygen from the water
Eutrophication • Excess nutrients promote algal growth… and its decay depletes water of oxygen needed by fish. Figure 14.18a
Eutrophication Oligotrophic water body Eutrophic water body Figure 14.18b,c
Creation of the hypoxic dead zone • Nitrogen input boosts phytoplankton… • …which die and are decomposed by microbes that suck oxygen from water, killing fish and shrimp. Figure 6.5
Too much of a good thing • Some extra nourishment increases fishery yields, but too much causes hypoxia, and yields crash. Figure 6.6
Climatographs • These climate diagrams show monthly temperature and precipitation variation for a particular site. • Climate patterns tend to be similar within a given biome. Figure 6.10
Aquatic “biomes” • Aquatic systems also show patterns of variation and can be categorized like biomes. • But the “biome” concept has historically been applied to terrestrial systems. • Aquatic systems are shaped not by air temperature and precipitation, but by water temperature, salinity, dissolved nutrients, currents, waves.*
Ecosystems • Ecosystem = all the interacting organisms and abiotic factors that occur in a particular place and time • Energy and nutrients flow among all parts of an ecosystem. • Conception of an ecosystem can vary in scale: • small pond • large forest • entire planet
Energy in ecosystems • Energy from sun • converted to • biomass (matter in organisms) • by producers • through photosynthesis • Rapid conversion = high primary productivity • (coral reefs) • Rapid plant biomass availability for consumers = high net primary productivity (rate at which biomass is produced) • (wetlands, tropical rainforests)
The hydrologic cycle How water flows through our environment Water enters the atmosphere by evaporation and by transpiration from leaves. It condenses and falls from the sky as precipitation. It runs off the land surface into streams, rivers, lakes, and eventually the ocean. Water infiltrates into aquifers, becoming groundwater. Plays a key role in nutrient cycles
The hydrologic cycle Figure 6.23
Falling water tables • If people deplete aquifers of groundwater faster than they recharge, water tables fall. • These villagers in Kenya have to dig deeper and deeper for water. Figure 6.24
Nutrient (biogeochemical) cycles These describe how particular chemicals cycle through the biotic and abiotic portions of our environment. Nutrients = elements and compounds organisms consume and require for nutrition and survival A carbon atom in your body could have been part of a dinosaur 100 million years ago.
Nutrient (biogeochemical) cycles Nitrogen: 78% of atmosphere In proteins and DNA In limited supply to organisms; requires lightning or bacteria to become usable A potent fertilizer Phosphorus: In ADP and ATP for metabolism In DNA and RNA In limited supply to organisms A potent fertilizer Nitrogen, carbon, and phosphorus are key nutrients. Carbon: Key component of organic molecules Atmospheric CO2 regulates climate
The nitrogen cycle • How nitrogen (N) moves through our environment • • Atmospheric N2 is fixed by lightning or specialized bacteria and becomes available to plants and animals in the form of ammonium ions (NH4+). Nitrogen Fixation* • • Nitrifying bacteria turn ammonium ions into nitrite (NO2–) and nitrate (NO3–) ions. Nitrate can be taken up by plants. • • Animals eat plants, and when plants and animals die, decomposers consume their tissues and return ammonium ions to the soil. • • Denitrifying bacteria convert nitrates to gaseous nitrogen that reenters the atmosphere.
The nitrogen cycle Figure 6.25
Human impacts on the nitrogen cycle • Haber and Bosch during WWI developed a way to fix nitrogen artificially. • Synthetic nitrogen fertilizers have boosted agricultural production since then. • Today we are fixing as much nitrogen artificially as the nitrogen cycle does naturally. Acid rain (nitric acid) • We have thrown the nitrogen cycle out of whack.
The carbon cycle How carbon (C) moves through our environment • Producers pull carbon dioxide (CO2) from the air and use it in photosynthesis. • Consumers eat producers and return CO2 to the air by respiration. • Decomposition of dead organisms, plus pressure underground, forms sedimentary rock and fossil fuels. This buried carbon is returned to the air when rocks are uplifted and eroded. • Ocean water also absorbs carbon from multiple sources, eventually storing it in sedimentary rock or providing it to aquatic plants.
The carbon cycle Figure 6.27
Human impacts on the carbon cycle • We have increased CO2 in the atmosphere by burning fossil fuels and deforesting forests. • Atmospheric CO2 concentrations may be the highest now in 420,000 years. • This is driving global warming and climate change. • Permafrost is a major carbon sink (frozen plant material). Global warming may release it.
Conclusions: Challenges • The Gulf of Mexico’s dead zone threatens coastal ecosystems and fishing economies. • We are depleting groundwater supplies. • We have doubled Earth’s nitrogen fixation. • We have increased CO2 concentrations in the atmosphere.
Conclusions: Solutions • Decreasing fertilizer application and finding other ways to lessen nitrogen runoff into the Mississippi River should mitigate the dead zone. • Conservation, desalination, and equitable distribution are solutions to groundwater depletion. • Modifications in the way we pursue agriculture can reduce artificial nitrogen fixation. • Reducing fossil fuel use and forest loss can reverse CO2 enrichment of the atmosphere.
This lecture will help you understand: • Water’s importance to ecosystems, economies, and human health • The hydrologic cycle and human interactions with it • Freshwater distribution • Freshwater ecosystems • Freshwater depletion • Freshwater pollution
Central Case: Plumbing the Colorado River • The once-mighty Colorado River is now dammed. So much water is withdrawn that it barely reaches the sea. • Western states apportion the water according to a pact, but California has long exceeded its share. • In 2003 the U.S. government cut California’s flow. Months of wrangling followed until a deal was reached.
Freshwater • Water that is relatively pure, with very few dissolved salts • Freshwater occurs in: • Lakes, rivers, streams, groundwater, glaciers, rainwater, soil, water vapor in the atmosphere • (In contrast, ocean water is salty because salts from land run into it and stay there as surface water evaporates.)
Freshwater • Only 2.5% of the planet’s water is freshwater. • And only 1% of that exists on Earth’s surface. • Only 1 part in 10,000 of water is easily accessible for drinking and irrigation. Figure 14.1
Hydrologic cycle • Recall the hydrologic cycle from earlier Figure 6.23
Hydrologic cycle: Colorado River • Air rising over the Rocky Mountains. drops precipitation that feeds the Colorado River’s headwaters. The air depleted of moisture creates a dry rainshadow east of the mountains. Figure 14.2
Colorado River • The river flows through arid country, nourishing ecosystems along its banks. • It dumps into the Sea of Cortez, where a large estuary once flourished. • Today so much water is withdrawn for irrigation and drinking supplies that the river barely makes it to the sea.
Groundwater • Water beneath Earth’s surface that did not evaporate, flow into rivers, or get taken up by organisms • Plays key role in hydrologic cycle, and in meeting human needs • 20% of all freshwater • Groundwater is contained in aquifers.
Aquifers • Aquifer = a porous spongelike layer of rock, sand, or gravel that holds groundwater • Confined or artesian aquifer = water under pressure, trapped within impermeable layers (often clay) • Unconfined aquifer = water under less pressure; no overlying impermeable layer • Aquifer recharge zone = geographic area where water infiltrates soil and recharges aquifer.
Groundwater and aquifers Figure 14.3
Ogallala Aquifer • World’s largest (881 mi3 of water before pumping) • Underneath U.S. Great Plains • Makes agriculture productive • Is being depleted by use for irrigation Figure 14.4
Freshwater distribution • Global freshwater distribution is very uneven. • Rainfall varies from nearly zero up to 1,200 centimeters (470 inches)/year. • Canada has 20 times as much water per citizen as does China.
Available freshwater resources • Nations vary by more than a factor of 100 inches of water per capita. Figure 14.5a
Available freshwater resources • Asia has lots of water but very little water per capita. • Australia has lots of water per capita but little water overall. Figure 14.5b
Freshwater ecosystems: Rivers and streams • Bodies of water that flow downhill, joining one another, shape the landscape. The beds of rivers move over time, depositing sediments over large areas of floodplain Figure 14.6a
Freshwater ecosystems: Lakes and ponds • Stationary bodies of water we call lakes and ponds also change slowly over time, through aquatic succession. Depending on nutrient input and other factors, these can be very productive and diverse ecosystems. Figure 14.6b
Freshwater ecosystems: Inland seas • Inland seas (such as the North American Great Lakes) are the largest freshwater bodies. Most biota are adapted to open water. Figure 14.6c