Download
1 / 14
140 likes | 237 Views
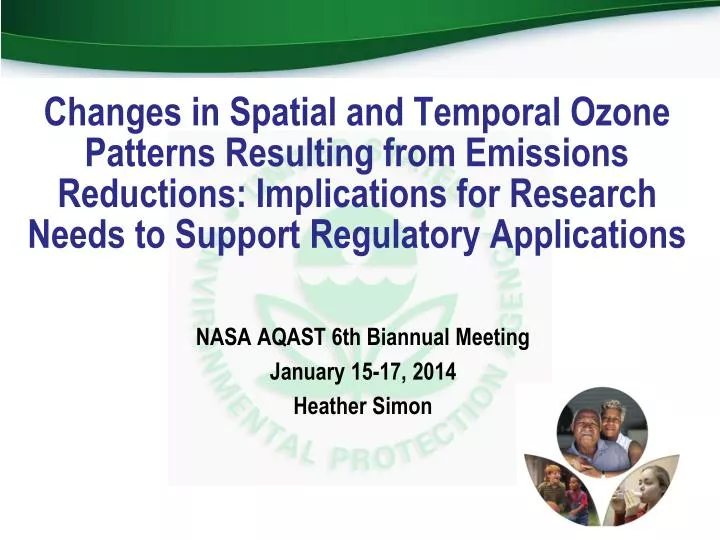
Changes in Spatial and Temporal Ozone Patterns Resulting from Emissions Reductions: Implications for Research Needs to Support Regulatory Applications. NASA AQAST 6th Biannual Meeting January 15-17, 2014 Heather Simon. Motivation.

E N D
Changes in Spatial and Temporal Ozone Patterns Resulting from Emissions Reductions: Implications for Research Needs to Support Regulatory Applications NASA AQAST 6th Biannual Meeting January 15-17, 2014 Heather Simon
Motivation • Ozone is an important atmospheric oxidant: changes in spatial and temporal ozone patterns affect NOx cycling and secondary aerosol formation • Changing spatial and temporal patterns will affect overall ozone exposure to individuals and populations • To fully evaluate health impacts of ozone it is important to understand changes in the entire ozone distribution, not just changes in peak concentrations • Ozone damage to plants is most reflective of cumulative rather than peak ozone exposure • Changing spatial patterns affect how areas will implement controls to meet air quality goals
Background • Our analysis indicates that regional NOx reductions are the most effective way to meet the current standard in most cities that are currently violating the ozone NAAQS • To better understand the effects of substantial emissions reductions on spatial and temporal patterns of ozone, we look at how ozone will change with 50% and 75% cuts in US Anthropogenic NOx emissions from 2007 levels • Model-predicted ozone response to across-the-board cuts in US anthropogenic NOx was applied to observed ozone concentrations on an hourly basis • Using the Higher Order Decoupled Direct Method (HDDM) in the CMAQ model, we were able to predict nonlinear response and estimate spatial and temporal patterns of ozone for various NOx cut scenarios • Details on methodology available at Simon et al. (2012) ES&T, 47, 2304-2313
Ozone Responses Analyzed in 15 Study Areas Boston Detroit New York Chicago Philadelphia Sacramento Cleveland Baltimore Denver Washington, DC St. Louis Los Angeles Atlanta Dallas Houston This talk will focus on select example results from these cities to demonstrate general patterns
Summary of Findings • In general we saw that high ozone concentrations decreased and low ozone concentrations increased in response to NOx emissions cuts • Most high ozone in the U.S. occurs in NOx limited conditions • Exceptions include some days in Houston and LA • Lowest ozone tends to occur in conditions where available NOx titrates ozone • Near large sources of NOx emissions where NOx/VOC ratios are high • At times when ozone production is low/absent • Nighttime • Winter • Cloudy days
Change in Diurnal Patterns of Ozone • As a result of NOx reductions: • Ozone decrease at the high end of distribution (especially during daytime) • Ozone increases at the low end of distribution(especially at night) • Interquartile range of ozone concentrations can increase or decrease depending on location and time of day
Change in Seasonal Patterns of Ozone • As a result of NOx reductions: • Ozone decrease at the high end of distribution (especially during summer) • Ozone increases at the low end of distribution(especially during winter) • Interquartile range of ozone concentrations can increase or decrease depending on location and time of day • Higher ozone days shift to earlier in the year
Philadelphia 3-yr avg of 4th high MDA8: 2006-2008 obs Chicago 3-yr avg of 4th high MDA8: 2006-2008 obs Changes in Spatial Patterns of 4th high Ozone Philadelphia with 75% NOx cuts Chicago with 75% NOx cuts ppb
Philadelphia Mean May-Sept MDA8: 2006-2008 obs Chicago Mean May-Sept MDA8: 2006-2008 obs Changes in Spatial Patterns of Seasonal Mean Ozone Inverted pattern Dampened pattern Philadelphia with 75% NOx cuts Chicago with 75% NOx cuts ppb
What Can Ambient Data Tell Us About These Trends? • We have an extensive ground-based ozone monitoring network with data dating back several decades • The past 15 years provide a “natural experiment” to look at ambient ozone trends over a period of dramatically decreasing NOx emissions • US NOx emissions dropped from 22.6 million TPY in 2000 to 12.9 million TPY in 2011 • Caution: past trends may not reflect behavior which will occur from future emissions reductions
Analysis of Ambient Ozone Trends Shows Spatial and Temporal Changes Over the Past Decade Qualitatively Similar to Those Predicted by Modeling Urban Chicago area trends Rural Chicago area trends May-Sep MDA8 Ozone (ppb) MDA8 Ozone (ppb) Oct-Apr Interquartile range 5th-95th percentile MDA8 Ozone (ppb) MDA8 Ozone (ppb) Year Year Urban monitors = population density > 1000 people/km2 Rural monitors = population density < 400 people/km2
Analysis of Ambient Ozone Trends Shows Spatial and Temporal Changes Over the Past Decade Qualitatively Similar to Those Predicted by Modeling Urban Philadelphia area trends Rural Philadelphia area trends Interquartile range 5th-95th percentile May-Sep MDA8 Ozone (ppb) MDA8 Ozone (ppb) Oct-Apr MDA8 Ozone (ppb) MDA8 Ozone (ppb) Year Year Urban monitors = population density > 1000 people/km2 Rural monitors = population density < 400 people/km2
A key challenge is to tease out effects from NOx changes vs other factors • NOx emissions reductions were not uniform in time or space • Emissions of VOCs also decreased to a lesser extent • Meteorological variability • Satellite NO2 measurements provide a good opportunity to correlate changes in ozone to changes in ambient NO2 • AQAST projects already underway provide a great opportunity for collaboration and policy-relevant analyses • Proposed AQAST tiger team project, 2013-2014: Relationships and trends among satellite NO2 columns, NOx emissions, and air quality in North America • Other ideas from the AQAST community are welcome What Can the AQAST Community Contribute?
Acknowledgements • Ben Wells • Adam Reff • Neil Frank • Karen Wesson