Download
1 / 7
70 likes | 231 Views
T18-08 Calculate MAD, MSE. Purpose Allows the analyst to create and analyze the MAD and MSE for a forecast. A graphical representation of history and forecast are shown. Inputs Historical Period Demand Forecast

E N D
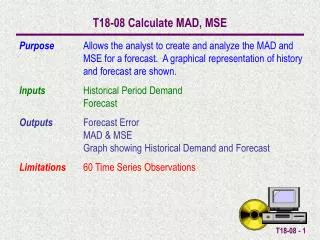
T18-08 Calculate MAD, MSE Purpose Allows the analyst to create and analyze the MAD and MSE for a forecast. A graphical representation of history and forecast are shown. Inputs Historical Period Demand Forecast Outputs Forecast Error MAD & MSE Graph showing Historical Demand and Forecast Limitations 60 Time Series Observations
Forecast Accuracy Given that a forecast is rarely correct, the methodology you choose should be the one which provides the least error from the actual historical demand. Forecasterror is defined as the difference between actual historical demand and the forecast.
Monitoring the Forecast There are two measures used to monitor the accuracy of a forecast. The Mean Absolute Deviation (MAD) and the Mean Squared Error (MSE). TheMADis the average of the absolute value of the forecast errors. The MSE is the average of the squared forecast errors. Note: The formula for the MSE shown above may vary slightly. Some textbooks divide the sum of the squared errors by n-1 rather than n.
Example Calculate the MAD and MSE for this forecast and show a graphical display of the history and forecast on the same graph.
The Error, MAD, and MSE are automatically calculated. Input the History Values and Forecast in the light green cells.
A graph showing the History Values and Forecast is automatically produced.