Download
1 / 52
520 likes | 671 Views
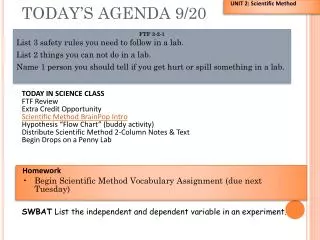
UNIT 2: Scientific Method. TODAY’S AGENDA 9/20. FTF 3-2-1 List 3 safety rules you need to follow in a lab. List 2 things you can not do in a lab. Name 1 person you should tell if you get hurt or spill something in a lab. TODAY IN SCIENCE CLASS FTF Review Extra Credit Opportunity

E N D
UNIT 2: Scientific Method TODAY’S AGENDA 9/20 FTF 3-2-1 List 3 safety rules you need to follow in a lab. List 2 things you can not do in a lab. Name 1 person you should tell if you get hurt or spill something in a lab. TODAY IN SCIENCE CLASS FTF Review Extra Credit Opportunity Scientific Method BrainPop Intro Hypothesis “Flow Chart” (buddy activity) Distribute Scientific Method 2-Column Notes & Text Begin Drops on a Penny Lab • Homework • Begin Scientific Method Vocabulary Assignment (due next Tuesday) SWBAT List the independent and dependent variable in an experiment.
UNIT 2: Scientific Method TODAY’S AGENDA 9/23 FTF Paperclip Demonstration TODAY IN SCIENCE CLASS FTF Distribute Scientific Method 2-Column Notes & Text Begin Drops on a Penny Lab • Homework • Scientific Method Vocabulary Assignment (due Tomorrow!) SWBAT Develop a hypothesis and subsequent experiment based on an observation.
PAPER CLIP DEMONSTRATION – 9/21TAKE A GUESS: HOW MANY PAPERCLIPS CAN WE FIT INTO A GLASS BEFORE THE WATER RUNS OVER? • Cohesion: water molecules are attracted to other water molecules. The oxygen end of water has a negative charge and the hydrogen end has a positive charge. The hydrogen of one water molecule are attracted to the oxygen from the other water molecules. This attractive force is what gives water is cohesive properties. • Surface Tension: Surface tension is the name we give to the cohesion of water molecules at the surface of a body of water. The cohesion of water molecules forms a surface “film” or “skin/” sSome substances may reduce the cohesive force of water, which will reduce the strength of the surface “skin” or the water.
DROPS ON A PENNY LABWITH YOUR PARTNER • We will learn about the steps of the scientific method while conducting a scientific experiment. • In this lab: • We will test how many drops of liquid will fit on a penny. • We will write a hypothesis to test. • We will use two different liquids. • We will learn about independent, dependent and control variables. • We will complete a data table. • We will write a conclusion based on our data.
The Scientific Method involves a series of steps that are used to investigate a natural occurrence.
Scientific Method Problem/Question Formulate a Hypothesis Experiment Collect and Analyze Results Conclusion Communicate the Results
DROPS ON A PENNY LABWITH YOUR PARTNER • What’s the Question? • Consider what we are going to do. • We will test how many drops of liquid will fit on a penny using different mixtures of water and soap. • So, what question are we going to test? Write down what you think it is.
DROPS ON A PENNY LABWITH YOUR PARTNER • Hypothesis • Take a look at the question that we are asking: Does the amount of soap mixed with water affect how many drops will stay on a penny? • How can we turn this question into a hypothesis? • If ……………. Then……………….. • So, what hypothesis can we test? Remember, a hypothesis needs to be testable. • Write your hypothesis on the Drops of Penny Lab Investigation worksheet.
UNIT 2: Scientific Method TODAY’S AGENDA 9/24 FTF (homework out please!) Write hypotheses based on the observations on the next slide. Work with your buddy! TODAY IN SCIENCE CLASS FTF Drops on a Penny Lab Finish Scientific Method 2-Column Notes & Text (with buddy) • Homework • Complete Drops on a Penny Lab! SWBAT Use data collected during an experiment to write a conclusion and support or reject their hypothesis.
FTF 9/24 Reminder: a hypothesis is a testable statement based on an observation. Usually they are stated If……. Then……. Problem: Your sunflower plant stopped growing. Observation: Last week you moved the plant from a sunny windowsill to the basement. • Write a hypothesis based on the observation. • Write an experiment to test the hypothesis. Problem: It’s winter time and your bedroom is really chilly at night. Observation: Last year you remember moving a box over the heater vent. • Write a hypothesis based on the observation. • Write an experiment to test the hypothesis.
DROPS ON A PENNY LABWITH YOUR PARTNER • Procedure: follow directions on the lab sheet. • Use eyedropper to place drops of plain water on the penny. (one at a time, slowly!) until any amount of water runs over the edge. • Count the number of drops and record in the table. • Repeat steps. • Repeat with soap mixture.
After you finish the lab activity, use the text to finish the 2-column notes. • You can choose to work alone or with your partner.
Steps of the Scientific Method 1. Problem/Question: Develop a question or problem that can be solved through experimentation.
Steps of the Scientific Method 3. Formulate a Hypothesis: Predict a possible answer to the problem or question. Example: If soil temperatures rise, then plant growth will increase.
Steps of the Scientific Method 4. Experiment: Develop and follow a procedure. Include a detailed materials list. The outcome must be measurable (quantifiable).
Steps of the Scientific Method 5. Collect and Analyze Results: Modify the procedure if needed. Confirm the results by retesting. Include tables, graphs, and photographs.
Steps of the Scientific Method 6. Conclusion: Include a statement that accepts or rejects the hypothesis. Make recommendations for further study and possible improvements to the procedure.
Steps of the Scientific Method 7. Communicate the Results: Be prepared to present the project to an audience. Expect questions from the audience.
Let’s put our knowledge of the Scientific Method to a realistic example that includes some of the terms you’ll be needing to use and understand.
Problem/Question John watches his grandmother bake bread. He ask his grandmother what makes the bread rise. She explains that yeast releases a gas as it feeds on sugar.
Problem/Question John wonders if the amount of sugar used in the recipe will affect the size of the bread loaf?
Caution! Be careful how you use effect and affect. Effect is usually a noun and affect, a verb. “ The effect of sugar amounts on the rising of bread.” “How does sugar affect the rising of bread?”
John talks with his teacher and she gives him a Experimental Design Diagram to help him set up his investigation.
Formulate a Hypothesis After talking with his teacher and conducting further research, he comes up with a hypothesis. “If more sugar is added, then the bread will rise higher.”
Hypothesis The hypothesis is an educated guess about the relationship between the independent and dependent variables. Note: These variables will be defined in the next few slides.
Do you know the difference between the independent and dependent variables?
Independent Variable The independent, or manipulated variable, is a factor that’s intentionally varied by the experimenter. John is going to use 25g., 50g., 100g., 250g., 500g. of sugar in his experiment.
Dependent Variable The dependent, or responding variable, is the factor that may change as a result of changes made in the independent variable. In this case, it would be the size of the loaf of bread.
Experiment His teacher helps him come up with a procedureand list of needed materials. She discusses with John how to determine the control group.
Control Group In a scientific experiment, the control is the group that serves as the standard of comparison. The control group may be a “no treatment" or an “experimenter selected” group.
Control Group The control group is exposed to the same conditions as the experimental group, except for the variable being tested. All experiments should have a control group.
Control Group Because his grandmother always used 50g. of sugar in her recipe, John is going to use that amount in his control group.
Constants John’s teacher reminds him to keep all other factors the same so that any observed changes in the bread can be attributed to the variation in the amount of sugar.
CONTROLS The constants in an experiment are all the factors that the experimenter attempts to keep the same.
CONTROLS They might include: Other ingredients to the bread recipe, oven used, rise time, brand of ingredients, cooking time, type of pan used, air temperature and humidity where the bread was rising, oven temperature, age of the yeast…
Experiment John writes out his procedure for his experiment along with a materials list in his journal. He has both of these checked by his teacher where she checks for any safety concerns.
Trials Trials refer to replicate groups that are exposed to the same conditions in an experiment. John is going to test each sugar variable 3 times.
Collect and Analyze Results John comes up with a table he can use to record his data. John gets all his materials together and carries out his experiment.
SIZE OF BAKED BREAD (LXWXH) CM3 Size of Bread Loaf (cm3) Trials Control group
Collect and Analyze Results John examines his data and notices that his control worked the best in this experiment, but not significantly better than 100g. of sugar.
Conclusion John rejects his hypothesis, but decides to re-test using sugar amounts between 50g. and 100g.
Experiment Once again, John gathers his materials and carries out his experiment. Here are the results.
SIZE OF BAKED BREAD (LXWXH) CM3 Size of Bread Loaf (cm3) Trials Control group
Conclusion John finds that 70g. of sugar produces the largest loaf. His hypothesis is accepted.
Communicate the Results John tells his grandmother about his findings and prepares to present his project in Science class.