Download
1 / 32
320 likes | 401 Views
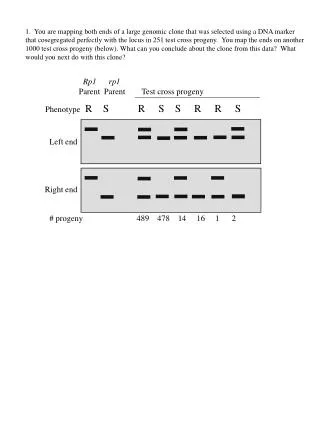
Proximal causes of diet in the desert horned lizard Phrynosoma platyrhinos in northern desert scrub. R. Anderson, S. Wilhoit, W. Boyle Western Washington University . Trophic interactions in desert systems are presumed to be strongly linked, hence:

E N D
Proximal causes of diet in the desert horned lizard Phrynosomaplatyrhinosin northern desert scrub R. Anderson, S. Wilhoit, W. Boyle Western Washington University
Trophic interactions in desert systems are presumed to be strongly linked, hence: • Annual trophic patterns in desert scrub communities are expected to be strongly influenced by annual variation in temperature and precipitation. • Thus, short term effects of climate on desert scrub communities are expected as bottom-up effects in production: • plants to herbivores (1o C) • herbivores to predators (2o C) • 2o C to mesopredators & apex predators (3oC).
The hypothesized bottom-up effects in production can be tested by correlational analyses of • Body condition of lizards, • Lizard abundances among years, • Annual productivity of the lizard’s prey, • Annual (short-term) climatic patterns in temperature and precipitation.
Gross Energy of Food Apparent Digestible Energy Fecal Losses Apparent Metabolizable Energy Urinary & Gaseous Losses Apparent Net Energy SDA & Fermentation Losses Maintenance Work Production: Growth, storage, reproduction But, Lizard Fecal “Losses” are a Fecologist’s Gain…
Subject Animals • Insectivore as a 2o consumer: Desert Horned Lizard, Phrynosomaplatyrhinos • Insects as 1o consumers: Harvester Ants, other ants
Desert horned lizard Phrynosomaplatyrhinos Even with the transmitter, the paint helps find this cryptic & hide-prone lizard
Research Site • Alvord Basin, Harney Co, OR • BLM administered public land • Great Basin desert scrub • 20% cover by perennial vegetation • Mix of sandy flats, dunes, and hardpan mesohabitats • Dominant perennial shrubs: • Basin big sage, Artemisia tridentata (ARTR) • Greasewood, Sarcobatusvermiculatus (SAVE)
On plot, view northward of Alvord Basin, with Steens Mountain, June 2011. (note the extensive cheatgrass in foreground)
Methods • Research period: late June to mid-July, 2003-2012 • Standard plot surveys for ants • Standardized annual pitfall trapping • Annual census of lizards on a 4 ha core plot • Capture-mark-release lizards on 5 surrounding ha • Weather records in the field, buttressed from weather station in nearby Fields, OR, compiled by the DRI, under auspices of WRCC.
Monthly mean daily air temperatures near study site (Fields) and other weather stations
Daily temperature patterns of air (15-35oC) and substratum (10-65oC) in the Alvord Basin during mid-summer (presumably influence timing and location of Phryonosomaplatyrhinosactivity).
10 Month to month precipitation patterns near study site (Fields) and at other weather stations in the region
Methods • Annual arthropod counts from pitfall traps • In 2012: 168 pairs of pitfall traps caught • 28851 macroarthropods • 11642 ants • 6354 non-ant walkers & perchers • 10855 flight-prone insects • Annual grasshopper counts • 3 count episodes per plot per time of day • 3 times of day, across 9 days (~1 per day per plot), • Eight 5m x 5m quadratsper each 10m x 40m plot, • 3 plots per mesohabitat, • 3 prevalent mesohabitats.
Pp 30% At 15% Gw 14%
Methods • Annual arthropod counts from pitfall traps • In 2012: 168 pairs of pitfall traps caught • 28851 macroarthropods • 11642 ants • 6354 non-ant walkers & perchers • 10855 flight-prone insects • Annual Ant counts • 3 count episodes per plot per time of day • 3 times of day, across 9 days (~1 per day per plot), • Eight 5m x 5m quadratsper each 10m x 40m plot, • 3 plots per mesohabitat, • 3 prevalent mesohabitats.
Patterns of Arthropod Abundance in Pitfall Traps 2004-2011 Analysis of Variance* Source Type III SS df Mean Squares F-ratio p-value Year 357,964.706 7 51,137.815 75.328 0.0001 Mesohabitat 31,120.345 2 15,560.172 22.921 0.0001 Plant Species 10,577.248 1 10,577.248 15.581 0.0001 Plant Size 2,503.398 2 1,251.699 1.844 0.159 Error 494,893.417 729 678.866 *Post hoc tests revealed these significant differences in annual abundances: Higher in 2005, 10, and 11 relative to 2004, 06-09 Rainfall total in both May 2010 & 2011 were about 3.75 cm
Ants caught in pitfall traps reveal 3 of the larger ant species as more available in sandy flat microhabitats * Includes data from inadvertent placements of pitfall traps near colony entrances N = 350 pitfall traps for 7 trap days in summer 2012 Rarer 7-8 species of ants are not reported here
Measures of abundance of ant colonies (Most were seen in open areas on the 10 x 40 m plots in two mesohabitats) Crmoare under-represented because they are hidden under plants
Preliminary video records in 2012 corroborate prior direct observation studies: more Pogonomyrmexcalifornicusto eat Thus, considering the two species that are most active in open areas, POCA is more available as prey
Thirteen of the 18 ant species on site were prey of P. platyrhinos in 2012 40 lizards, 178 fecal pellets, 4.5 fecal pellets per lizard (4.5 days of feeding), totaling about 369 ants per lizard, 14,762 ant prey among the 40 lizards in 2012
The first few meters are visible by powder tracking even during the day
Powder track map Approximate home ranges of radio tracked P. platyrhinosin 2009 100 m
Spatial pattern of P. platyrhinosmovement relative to shrub locations
Strong correlates with lizard SVL:gut-empty lizard mass & # ants in largest fecal pellet 1.62 N= 18 P. platyrhinos N= 43 P. platyrhinos 1.30 Log Mass (g) 0.99 2012 2012 0.67
Fecal pellet mass & size correlate with # of ants in the pellet Log Mass of Pure Pellet N= 38 pellets, one per PHPL in 2012 (Similar pattern with only Harvester Ants, Pogonomyrmexcalifornicus)
Some females are thin & have stomachs laden with nematodes, then die shortly after egg-laying…
Considerations Weighing gut-empty lizards is an estimate of “condition index” Other ways to compare among individuals for production-related outcomes: Fecal pellet size (& mass, if one is careful careful) Counting & identifying size of prey in fecal pellet mass Documenting spatiotemporal patterns of prey availability Individual activity time and activity intensity (focal observations aided by tracking methods)
Mechanistic studies of population changes are needed.This parasite-host relationship is an opportunity.We are ready to embark on DLW studies acrossseasonal & annual extremes in this far-northern desert.