Download
1 / 31
310 likes | 482 Views
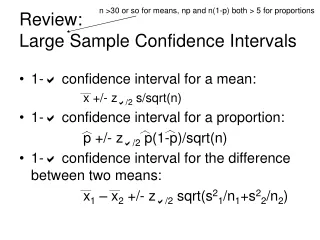
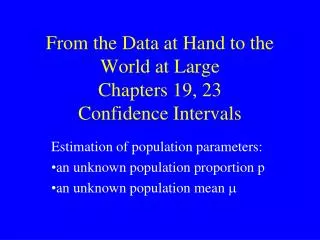
From the Data at Hand to the World at Large Chapters 19, 23 Confidence Intervals. Estimation of population parameters: an unknown population proportion p an unknown population mean . Concepts of Estimation.

E N D
From the Data at Hand to the World at LargeChapters 19, 23Confidence Intervals Estimation of population parameters: an unknown population proportion p an unknown population mean
Concepts of Estimation • The objective of estimation is to estimate the unknown value of a population parameter, like the mean , on the basis of a sample statistic calculated from sample data. e.g., NCSU housing office may want to estimate the mean distance from campus to hometown of all students • There are two types of estimates • Point Estimate • Interval estimate
What do we frequently need to estimate? • An unknown population proportion p • An unknown population mean ? p?
Point Estimates • The sample mean is the best point estimate of the population mean • p = , the sample proportion of x successes in a sample of size n, is the best point estimate of the population proportion p ^
Example: Estimating an unknown population proportion p • Is Herb Sendek's departure good or bad for State's men's basketball team? (Technician opinion poll; not scientifically valid!!) • In a sample of 1000 students, 590 say that Sendek’s departure is good for the bb team. • p = 590/1000 = .59 is the point estimate of the unknown population proportion p that think Sendek’s departure is good. ^
Example: Estimating an unknown mean • In an effort to improve drive-through service, a Burger King records the drive-through service times of 52 randomly selected vehicles. • The sample mean service time =181.3 seconds is the point estimate of the unknown mean service time
^ Another type of estimate Shortcoming of Point Estimates • = 181.3 seconds, best estimate of mean service time • p = 590/1000 = .59, best estimate of population proportion p BUT How good are these best estimates? No measure of reliability
Interval Estimator • A confidence interval is a range (or an interval) of values used to estimate the unknown value of a population parameter . • http://abcnews.go.com/US/PollVault/
Standard Normal P(-1.96 z 1.96) =. 95
Confidence level Sampling distribution of .95
Standard Normal P(-1.96 z 1.96) =. 95
Example (Gallup Polls) http://abcnews.go.com/US/PollVault/story?id=145373&page=1
Medication side effects (confidence interval for p) Arthritis is a painful, chronic inflammation of the joints. An experiment on the side effects of pain relievers examined arthritis patients to find the proportion of patients who suffer side effects. What are some side effects of ibuprofen? Serious side effects (seek medical attention immediately): Allergic reaction (difficulty breathing, swelling, or hives), Muscle cramps, numbness, or tingling, Ulcers (open sores) in the mouth, Rapid weight gain (fluid retention), Seizures, Black, bloody, or tarry stools, Blood in your urine or vomit, Decreased hearing or ringing in the ears, Jaundice (yellowing of the skin or eyes), or Abdominal cramping, indigestion, or heartburn, Less serious side effects (discuss with your doctor): Dizziness or headache, Nausea, gaseousness, diarrhea, or constipation, Depression, Fatigue or weakness, Dry mouth, or Irregular menstrual periods
440 subjects with chronic arthritis were given ibuprofen for pain relief; 23 subjects suffered from adverse side effects. Calculate a 90% confidence interval for the population proportion p of arthritis patients who suffer some “adverse symptoms.” What is the sample proportion? For a 90% confidence level, z* = 1.645. We are 90% confident that the interval (.034, .070) contains the true proportion of arthritis patients that experience some adverse symptoms when taking ibuprofen.
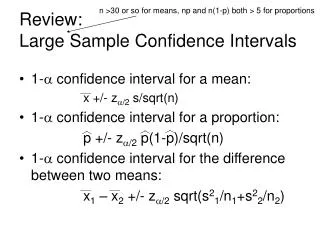
Tool for Constructing Confidence Intervals for : The Central Limit Theorem • If a random sample of n observations is selected from a population (any population), then when n is sufficiently large, the sampling distribution of x will be approximately normal. (The larger the sample size, the better will be the normal approximation to the sampling distribution of x; we’ll use n 30)
Estimating the Population Mean when the Population Standard Deviation is Known • How is an interval estimator produced from a sampling distribution? • To estimate m, a sample of size n is drawn from the population, and its mean is calculated. • Under certain conditions, is normally distributed (or approximately normally distributed by the CLT).
Standard Normal P(-1.96 z 1.96) =. 95
Confidence level Sampling distribution of x .95
Four Commonly Used Confidence Levels Confidence LevelMultiplier .90 1.645 .95 1.96 .98 2.33 .99 2.58
Example Summary • 90% (30.06, 30.74) • 95% (29.995, 30.805) • 98% (29.919, 30.881) • 99% (29.867, 30.933) • The higher the confidence level, the wider the interval • Increasing the sample size n will make a confidence interval with the same confidence level narrower (i.e., more precise)
Example • Find a 95% confidence interval for p, the proportion of small businesses in favor of a tax increase to decrease the national debt, if a random sample of 1000 found the number of businesses in favor of increased taxes was 50.
Interpreting Confidence Intervals • Previous example: .05±.014(.036, .064) • Correct: We are 95% confident that the interval from .036 to .064 actually does contain the true value of p. This means that if we were to select many different samples of size 1000 and construct a 95% CI from each sample, 95% of the resulting intervals would contain the value of the population proportion p. (.036, .064) is one such interval. (Note that 95% refers to the procedure we used to construct the interval; it does not refer to the population proportion p) • Wrong: There is a 95% chance that the population proportion p falls between .036 and .064. (Note that p is not random, it is a fixed but unknown number)