Download
1 / 41
410 likes | 503 Views
Explore the effectiveness of different algebra catch-up approaches for underprepared 9th graders to improve math proficiency. Results from a randomized trial are analyzed to assess growth in intermediate math skills and algebra proficiency.

E N D
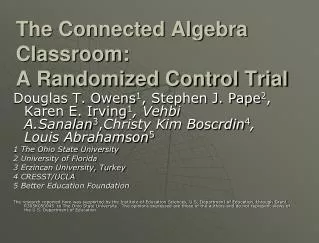
Results from a Randomized Trial of Two Algebra Sequences for Underprepared Freshmen Ruth Curran Neild Vaughan Byrnes Robert Balfanz
Motivation for the Study • States and districts increasingly consider Algebra 1 to be the “default” course for all 9th graders • AND YET – • In districts with “Algebra for All” policies, course failure rates in Algebra have been high (Los Angeles, Milwaukee, Chicago)
Large percentages of ninth graders in low-performing districts are underprepared for Algebra (Data from Philadelphia, adapted from Neild and Balfanz, 2005)
Where is “catch up” required? • Intermediate mathematics skills: fractions, decimals, signed numbers Complete the following statement with >, <, or = .56 _____ ¾
Where is “catch up” required? • Pre-algebra skills, including: • Graphing • One- and two-step equations • Inequalities • Mathematics reasoning skills • Does this answer/argument make sense? • What are the patterns?
“Double dosing” is a common ninth grade “catching up” strategy
Options for extended time • Provide an additional 45-50 minute Algebra support course during the school day (Philadelphia, Chicago) • Place students into a year-long Algebra course that meets ~90 minutes each day and allows time for catch up as needed • Provide a structured catch-up course first semester, followed by Algebra 1 second semester (class meets ~90 minutes each day)
The Conditions Catch Up Course Followed by Algebra 1 Course Year-LongAlgebrawith Embedded Catch Up Year-long 80-90 minute class, taught by the same teacher Algebra curriculum is of the district’s choosing Conceptualized as the “business as usual” condition • Year-long 80-90 minute classes, taught by the same teacher • First semester course is the Transition to Advanced Mathematics Curriculum, developed by Johns Hopkins • Second semester is Algebra curriculum of the district’s choosing
Transition to Advanced Math (TAM) Genesis of the curriculum was observation of a quandary: either fail most students or water down the content Recognizes material and human capital challenges in low-resource schools through student consumables, tightly organized curriculum, and classroom kits of materials.
Transition to Advanced Math (TAM) Five Units: Mathematical Reasoning, Data Analysis, and Probability Numbers and Integers Rational Numbers Measurement Patterns and Functions & Introduction to Algebra
Study Details • Two cohorts of districts: eight in 2008/09, five in 2009/10 (13 district in total) Implementation/data collection in each district for a single year • Randomization within districts, at the school level • Students who are 1-4 years below grade level in mathematics are eligible to participate
Research Questions Primary questions • Are there mid-year differences between the conditions in growth in intermediate mathematics skills? • Are there end-of-year differences between the conditions in Algebra proficiency? • Are there differences between the conditions in mathematics grades during semester 1 and semester 2?
September September End of first semester (~January) ALGEBRA PROFICIENCY (Orleans-Hanna & CTB Algebra) End of year (~May) Instrumentation INTERMEDIATE MATH SKILLS (CTBS)
Other Instrumentation • Student and teacher surveys: Beginning-of-year and end-of-year • Classroom observations, with quantitative measures and narrative: once each semester
Basic Models • Multi-level modeling (HLM) • 3-level model with students nested within teachers, within schools • Uncontrolled (empty) model • Model with student, teacher, and school controls • (4,941 Students – 131 Teachers – 46 Schools)
Robust Results Results for all achievement outcomes were consistent when re-tested using several supplementary methods, Including: • Best-Fit Models for each outcome • Analyses with only complete case data • Analyses with only those targeted students, 1-4 GE behind • Testing for interaction between treatment effect and prior achievement levels
INTERVENING FACTORS AND INTERMEDIATE OUTCOMES: Classroom PRACTICES & attitudes toward mathematics
Measure: Classroom Practices, including: • Students used objects or tools, such as rulers, protractors or algebra tiles • The teacher asks students to explain how they got their answers. • When I didn't understand something my teacher tried to help by asking questions • Students are asked to show more than one way of solving a math problem • I worked on math problems during class time with other students in my class • I was asked to write a few sentences about how I solved a math problem • Students worked in small groups or with a partner • My teacher uses real-life examples to help us understand math • The teacher made sure that everyone understood before moving on to another topic
Measure: Attitudes Toward Math Class, including: • I liked coming to math class • I paid attention in math class • I did my math homework • I felt that I could do almost all the work in math if I didn’t give up. • I felt confused in math class. • I worked hard in math class. • I studied for math tests and quizzes. • I felt successful in math. • I felt confident that I could do the math work.
Estimated Effect of Classroom Practices & Attitudes on Student Outcomes
Estimated treatment effect on Classroom Practices & Attitudes
Finally… • Fall to Winter Gains made in Intermediate Math were significantly related to spring Algebra scores when modeled • So, while TAM students may not have performed significantly higher in Spring Algebra, their 1st semester gains in basic math skills were related to improved Algebra performance
Conclusions • TAM students improved significantly more in terms of their intermediate math skills. • TAM students performed equally to Stretch students in Algebra, despite spending only half as much of the school year on the topics. • TAM students experienced higher levels of intermediate outcomes which indirectly lead to better Algebra outcomes (intermediate math gains, and better Classroom Practices).