Download
1 / 7
70 likes | 220 Views
PowerPoint to Accompany Criminal Justice Eighth Edition James Inciardi Chapter 4 Criminal Statistics and the Extent of Crime. Major Sources of Crime Statistics.

E N D
PowerPoint to AccompanyCriminal JusticeEighth EditionJames InciardiChapter 4Criminal Statistics and the Extent of Crime
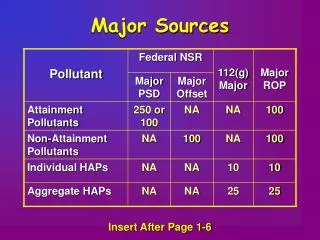
Major Sources of Crime Statistics • Uniform Crime Report (URC)At the 1927 annual meeting of the International Association of Chiefs of Police, the Committee on Uniform Crime Reports was appointed to respond to the demand for national crime data. • National Opinion Research Center (NORC)Housed at the University of Chicago, the NORC surveyed 10,000 households in 1965 regarding crime experienced. • National Crime Victimization Survey (NCVS)This survey is conducted by the Bureau of the Census under the direction of the Department of Justice. • National Survey of Drug Use and HealthA survey of use of illicit drugs by the general household population • Monitoring the Future SurveyAn annual survey of high school students on personal drug use. 4-2
Limitations of the Uniform Crime Reports • UCR estimates of the volume and rates of crime are considerably lower than the actual frequency of criminal acts. • By its very nature, crime is subject to concealment and non-reporting. • Some studies have documented as many as 20% of citizen complaints may not be recorded in police figures. • By examining UCR figures from the perspective of rates and proportions, however, as opposed to absolute numbers, some bias can be eliminated. 4-3
The Crime Index • First published in 1960, the Crime Index has been under scrutiny for its consistency as a barometer of criminality. • Since the Crime Index is a total that does not distinguish the seriousness of different crimes, critics have charged that it creates a biased-overall crime rate. • Leading criminologists, sociologists, and other advisory groups have urged for the development of a more robust index. • In June 2004, the Advisory Panel Board of the Criminal Justice Information Service (CJIS), a division of the FBI, approved discontinuing the use of the Crime Index as a true indicator of crime. • The FBI will continue publishing a violent crime total and a property-crime total until a more viable index is developed. 4-4
Strengths of Self-Reporting Victimization Surveys In addition to their use as a check on the limitations of standard crime-reporting mechanisms, they can also be used to determine the following information: • The amount of crime committed by the “normal” (typically non-criminal) population • What kinds of crime typically remain unknown • How the official system of crime control selects cases to pursue • Whether certain categories of offenders are over- or under-selected by official control mechanisms • Whether explanations and theories of crime developed for officially known offenders apply to non-registered offenders as well 4-5
Weaknesses of Self-Reporting Victimization Surveys Besides these potential methodological problems, there are other possible sources of error, such as the following: • Those who agree to answer questions may be markedly different from those who refuse, which leaves in doubt the representativeness of any sample of people interviewed. • Those who respond to such inquiries may he truthful in their answers but may choose to conceal large segments of their criminal backgrounds. • Most studies have focused on groups of students and other juveniles, stressing the incidence of unrecorded delinquency; few studies have targeted populations of adult offenders. 4-6
Crime Rate (per 100,000) Comparisons Between the First NORC Survey and the UCR Source: President’s Commission on Law Enforcement and Administration of Justice , 1967 4-7