Download
1 / 34
360 likes | 730 Views
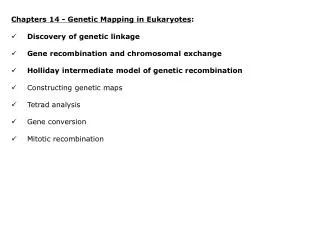
Chapters 14 - Genetic Mapping in Eukaryotes : Discovery of genetic linkage Gene recombination and chromosomal exchange Holliday intermediate model of genetic recombination Constructing genetic maps Tetrad analysis Gene conversion Mitotic recombination. Genetic Mapping in Eukaryotes :

E N D
Chapters 14 - Genetic Mapping in Eukaryotes: • Discovery of genetic linkage • Gene recombination and chromosomal exchange • Holliday intermediate model of genetic recombination • Constructing genetic maps • Tetrad analysis • Gene conversion • Mitotic recombination
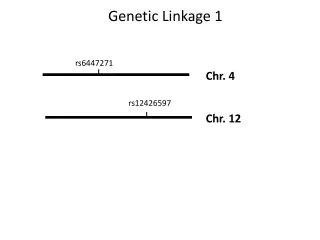
Genetic Mapping in Eukaryotes: • Genes on non-homologous chromosomes assort independently. • Genes on the same chromosome (syntenic) are physically linked (linkage group) and may be inherited together. Classical genetics: • Analyzes the frequency of of allele recombination in genetic crosses. • New combinations of parental alleles are produced by recombination (crossing-over during meiosis I). • Test-crosses are used to determine which genes are linked and create a linkage map showing the relative distances of markers on each chromosome.
How does linkage affect Mendelian segregation patterns? Discovery of genetic linkage in Drosophila (Thomas H. Morgan, ~1911) • Morgan determined that the gene for white-eyes (w) and a gene for miniature wings (m) occur on the X-chromosome. • Cross female white-miniature (wm/wm) & wild type male (w+m+/Y): wm x w+m+ w+m+ & wm wm (Y) wm (Y) • F1 wild type (w+m+/wm) females and white-eyed miniature wing (wm/ Y) males.
Discovery of genetic linkage in Drosophila (Thomas H. Morgan, ~1911) F1 x F1 w+m+ x wm wm (Y) F2“parental” genotypes and phenotypes (same allele states as F1): w+m+wild-type female (n = 439) wm w+m+wild-type male (n = 352) (Y) wm white-eye/miniature female (n = 359) wm wm white-eye/miniature male (n = 391) (Y)
Morgan also observed F2 non-parental genotypes and phenotypes: w+mwild-type eye/miniature female (n = 235) wm w+mwild-type eye/miniature male (n = 210) (Y) wm +white-eye/wild-type wing female (n = 218) wm wm+white-eye/wild-type wing male (n = 237) (Y) F1 x F1 w+m x wm wm+ (Y) • Non-parental combinations of linked genes are called recombinants. • 50% recombinant phenotypes are expected if independent assortment occurs. • Morgan observed 900/2,441 (36.9%) recombinant phenotypes and concluded that the two genes must be linked.
Fig. 14.1, Morgan’s experimental cross of white-eyes and miniature wings.
Morgan also observed and hypothesized: Parental phenotypes always were more common in many other types of crosses, and recombinant phenotypes occurred less frequently. During meiosis, some alleles assort together because they lie adjacent to each other on the same chromosome. The closer two genes are on the chromosome, the more likely they are to remain together during meiosis. Recombinants are produced by crossing-over.
Mechanism of crossing-over gives rise to recombinant (non-parental) genotypes and phenotypes for linked genes.
Some basics terminology about crossing-over: Crossing over occurs in prophase I of meiosis I. Chiasma (pl. chiasmata) is the site where crossing-over occurs. Crossing-over is a reciprocal exchange of DNA, involving breaking and rejoining of homologous chromatids. Crossing-over leads to recombination between linked genes and produces novel genetic variation.
Gene recombination and chromosomal exchange: Convincing experimental evidence for Morgan’s hypothesis was not obtained until the 1930s. Harriet B. Creighton & Barbara McClintock (1931) studied corn (Zea mays). Creighton & McClintock crossed a strain of corn heterozygous for two genes on chromosome 9. One gene determines color (C =colored, c = colorless) and the other determines starch (Wx =standard, wx = mutant). A large piece of chromosome 8 also had broken off and reattached to one of the two 9 chromosomes (translocation). At the opposite end, the same chromosome 9 also possessed dark-staining knob (2 visible cytogenetic markers). As a result, recombinant phenotypes could be correlated with cytological features visible under the microscope. Whenever recombinant phenotypes appeared, cytological features also showed recombination.
Fig. 15.2 2nd edition, Creighton’s and McClintock’s Corn Experiment
Several weeks later: • Curt Stern reported identical results in Drosophila • Stern’s Drosophila experiment included: • Two linked gene loci for eye color (car = carnation) and shape (B = bar-shaped) • Female carried two cytologically distinct chromosomes: • One X chromosome possessed a translocated Y fragment. • The other X chromosome was visibly shorter.
Fig. 14.2, Stern’s Drosophila Experiment *Recombinant phenotypes and recombinant cytological features show perfect correlation.
Molecular mechanism for crossing-over (Robin Holliday, 1960s): • Homologous chromosomes “recognize” and align. • Single strands of each DNA (one on each chromosome) break and anneal to the opposite chromosome forming Holliday intermediate. • As chromosome ends pull apart, branch point migrations occur to create a 4-arm intermediate structure. • 4-arm intermediate is cut by by endonucleases in one of 2 planes. • DNA seals the gaps. • Model predicts that physical exchange between two gene loci at the ends of the chromosomes should occur about 50% of the time. • One pattern (intermediate cut in one plane) yields the parental arrangement. • The other (cut in the other plane) is recombinant.
Box 15.1 2nd edition, Holliday model of chromosome recombination
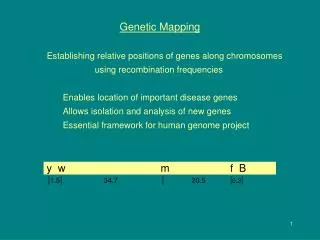
Constructing genetic maps: • Number (%) of genetic recombinants produced reflects gene linkage relationships. • Recombination experiments can be used to generate genetic maps. • Perform a test cross to determine that genes are linked. • Select a test cross including a homozygous recessive (or homozygous dominant) individual for all genes involved. • If loci are not linked and the second parent is a heterozygote, all 4 phenotypes will occur in equal numbers in the F1 (2 loci) and the ratio of parentals to recombinants will be 1:1. • Compare observed and expected using a goodness of fit test and significant P-value < 0.05. • Significant deviations from these ratios indicate linkage.
Two arrangements of alleles exist for an individuals heterozygous at two loci. cistrans w+m+ or w+m w m w m+ • Cross-over of cis results in trans and vice versa. • Frequency of recombinants (%) is a characteristic of each gene pair, regardless of cis or trans arrangements. • Sturtevant (1913) recognized that recombination frequencies could be used to create a map. • 1% cross-over rate = 1 map unit (mu) or centiMorgan (cM). • Map units (mu) and centiMorgans (cM) are relative measures.
Cross-over is more likely between distant genes than close genes.
First genetic map was for Drosophila: • 3 sex-linked genes • w = white-eyes • m =miniature wings • y = yellow body • Recombination frequencies: • w x m = 32.6 • w x y = 1.3 • m x y = 33.9 y w m 1.3 mu 32.6 mu
Use different types of test-crosses to map genes with different types of linkage and dominance relationships: Example 2-point test crosses (cross with homozygote): Autosomal recessive: Aa/Bb x aa/bb Autosomal dominant: Aa/Bb x AA/BB X-linked recessive: Aa/Bb x ab/Y X-linked dominant: Aa/Bb x AB/Y • Expected frequencies of parental and recombinant genotypes (in absence of linkage) are 1:1. • Number (%) recombinants is used directly as the map unit. • Measurement is most accurate when genes are close together. • Scoring large numbers of progeny increases accuracy. • Direct correspondence between linkage groups and the linear sequence of genes on a chromosome.
More about using test-crosses to determine linkage: • 3-point test-crosses (Aa/Bb/Cc x aa/bb/cc) also are a common technique, allow simultaneous analysis of several traits. • Known recombination rates (i.e., linkage relationships) can be used to predict progeny phenotypes (of interest to breeders). • For any test-cross, recombination rate cannot exceed 50%. • Observed recombination rate of 50% = no linkage. • No linkage indicates that genes are: • (1) on separate chromosomes • (2) very far apart on the same chromosome • (1) and (2) can be distinguished by mapping multiple genes in the same linkage groups. • Recombination frequency generally underestimates true map distance (corrected with mapping functions).
Fig. 14.10 - Mapping function are used for corrections because the recombination frequency can underestimate the true map distance.
Fig. 14.7, How to calculate recombination frequencies: Calculate (%): p x j (%) = (52+ 46 +4 + 2)/500 = 20.8% j x r (%) = (22 + 22 + 4 + 2)/500 = 10.0% p x r (%) = (p x j) + (j x r) = 30.8% r+
Fig. 14.8, How to calculate recombination frequencies: Calculate (%): p x j (%) = (52+46+4+2)/500 = 20.8% j x r (%) = (22+22+4+2)/500 = 10.0% p x r (%) = (52+46+22+22+2(4+2)) = 30.8%
When does crossing over occur? • Possibilities: • Prophase I of meiosis I: 4-chromatid stage after chromosomes are duplicated • Interphase prior to meiosis: 2-chromatid stage before chromosomes are duplicated • Ordered tetrad experiments with Neurosporacrassa (orange bread mold) and the arrangement of ascospores in the ascus indicate the pattern of crossing over.
Tetrad analysis of haploid eukaryotes: • Tetrad refers to the four haploid gametes produced by meiosis. • Tetrad may be ordered (e.g., Neurospora) or unordered (e.g., yeast). • In haploid organisms, phenotype corresponds directly with genotype of each member of the tetrad (no dominance or recessiveness). • Haploidy simplifies interpretation of results and linkage mapping. • Three of the most common organisms used for tetrad analysis (each have asexual and sexual mating types): • Yeast (Saccharomyces cerevisiae) • Green algae (Chlamydomonas reinhardtii) • Orange bread mold (Neurospora crassa)
Ordered Tetrad Experiment with Neurospora Crossing-over occurs at the 4-chromatid stage, and not the 2-chromatid stage, in prophase I of meiosis after chromosomes are duplicated.
Gene conversion: • Process by which DNA sequence information is transferred from one DNA helix (which remains unchanged) to another DNA helix, whose sequence is altered. • Gene conversion is a type of Non-Mendelian Inheritance. • Evidence for conversion occurs when tetrad gamete genotype ratios are 3:1 or 1:3 instead of 4:4, 2:4:2, or 2:2:2:2. • Example: m+/m+ x m/m m+/m+/m+/m • Can be caused by mismatch during a recombination event, mismatch is excised (using exonuclease) and replaced (w/DNA polymerase), overwriting the previous base pairs.
Box 16.1 2nd edition, Gene conversion
Why does conversion occur? • We look to the gene duplication literature for some answers. • Paralogous genes with new, but potentially similar functions (divisions of labor) originate by gene duplication. • Example - Fetal hemoglobins (Hbs) exhibit higher affinity for O2 than adult Hbs, and expression of isoforms is developmentally regulated.
Example - Species of birds that fly at extremely high elevations (11,300 meters) like the Ruppell’s Griffon possess a mixture of different Hb isoforms (HbA, HbA’, HbD, HbD’), each with different O2 affinity. Like fetal hemoglobins, different isoforms have arisen from gene duplications. Gene duplication relaxes of selective constraints on gene function. Old gene copy can serve original function. New gene copy can serve similar but novel function (neofunctionalization). Following duplication mutation/genetic drift cause sequences to diverge. Gene conversion between paralogous genes can maintain similarity of structure and function over evolutionary time. Balance between mutation/drift & gene conversion evolves.
Mitotic recombination: • Crossing-over sometimes occurs in mitosis (i.e., somatic cells)! • First observed by Curt Stern (1936) in heterozygous Drosophila carrying sex-linked mutations for yellow body color (y+/y) and singed bristles (sn/sn+). • Mitotic cross-over occurred in heterozygotes and appeared as a mosaic of two different phenotypes in the same individual. • Possibly explained by non-disjunction, but mosaic regions were always adjacent, and therefore likely to be products of the same genetic event. Fig. 16.6, 2nd edition
Fig. 16.7, 2nd edition Mitotic cross-over in Drosophila