Creating and editing spatial data RESM 440 Lecture 12
270 likes | 476 Views
Creating and editing spatial data RESM 440 Lecture 12. Today. Tests: All have been graded, will be handed back next week after everyone takes the exam Grades on ecampus now for everyone Topic: Creating and editing spatial data This week in lab: Using imagery, digitizing

Creating and editing spatial data RESM 440 Lecture 12
E N D
Presentation Transcript
Today • Tests: • All have been graded, will be handed back next week after everyone takes the exam • Grades on ecampus now for everyone • Topic: • Creating and editing spatial data • This week in lab: • Using imagery, digitizing • Extra reading: Bolstad, Chapter 4
Overview • Review: Where spatial data comes from • Editing vector datasets: Digitizing • Forms of digitizing • Digitizing and accuracy • Specifics of digitizing • Preparing source maps
Review • Sources for spatial data • Other methods already covered • Obtaining existing datasets • Image classification (remote sensing) • Turning information into maps • GPS coordinates • Tabular joins to existing data • Digitizing your own data • Source maps: Aerial photos, paper maps
GPS Overview • GPS = Global Positioning Systems • Used to collect locations in the field • Network of 20+ satellites in orbit • GPS receivers use signals from satellites to determine location • Accuracy varies • Few cm ($$$$$) to • Several meters ($) • Data collected may be used in GIS
Collecting GPS data • Not just humans… Remotely operated vehicle (underwater) Tracking collars on animals
180º 150º 120º 60º 30º 90º 90º 60º 30º 0º Using GPS data • GPS coordinates give longitude (X) and latitude (Y) • Usually saved in a table (Excel) 0º WEST Longitude (X) NORTH Latitude (Y)
Preparing GPS data for use in GIS • GPS “waypoint” X, Y coordinates may need to be converted for use in GIS, use Excel to convert data using formula below • GIS requires a single X, single Y value • Most commonly used: Decimal degrees • Degrees: units of measurement in lat/long system on the globe • 60 “minutes” in one degree of longitude or latitude • 60 “seconds” in one minute FOR NEXT TIME:REVISE or REMOVE THESE SLDIES. Conversion Formula Minutes 60 Seconds 3600 DD = Degrees + + Remember to convert X to negative (after calculation)
Preparing GPS data for use in GIS: Steps • Convert data to decimal degrees in Excel • Save Excel spreadsheet in correct file format • Make sure 1st row includes column headings • Column headings cannot include spaces, must be unique
In GIS software: Steps • In ArcGIS: Display XY data menu option • Automatically maps locations as points using X,Y coordinates from table Fish Sampling Points Pymatuning Lake, PA WVU Wildlife Mgmt Class (2007)
Digitizing • Types of map data sources: • Hardcopy: refers to hand-drawn or printed paper maps • Digital: refers to computerized information • Digitizing is the process of collecting digital spatial coordinates = data entry for GIS… • Data collection is very significant part of any GIS project
Forms of digitizing • Manual • Input data source: Paper map • Uses digitizing table, light table • Users move “puck” over map, click to trace features • Heads-up or on-screen • Input data source: Scanned map or image • Move & click mouse to trace features on the screen • Automated • Input data source: Scanned map • Computer software “recognizes” features on the map
Forms of digitizing Manual Automated On Screen
1:24,000 Quads The process of digitizing: On-screen • Obtain source dataset(s) Morgantown North Quad • For each quad: • Aerial photos • DOQQs (late 1990s) • SAMB (2003) • NAIP (2007, 2009, 2011) • Scanned topo maps (DRGs)
The process of digitizing: On-screen • Create new output dataset (e.g. shapefile) • Specify file name, feature type • Point, line, polygon • Specify projection (i.e. UTM) • Attribute table fields • Easily done in Catalog window
Double-click to end Step 3. Create new features • Digitizing: • Points • Lines • Polygons • Nodes: Starting and ending points of lines • Vertices: Internal XY points in lines Double-click to end Polygon automatically closes itself Points Lines Polygons
The process of digitizing: On-screen • Start editing output dataset • Create new features: • Trace outlines of features • Edit features and attributes • Correct mistakes • Edit table: Labels, etc. • Save your work Football Field
Editing features • Many options exist to make your digitized features more neat and precise: • Copy/paste • Split • Merge • Digitize using exact angle, direction, or distance • Add new polygon with shared border
Snapping • Common errors in digitizing: • Dangles • Overshoots • Slivers along borders • Snapping • A method to make sure your vertices exactly match up Snapped!
Digitizing and accuracy • What affects accuracy of digitized data? • Humans interpret source maps as they go along – mistakes in interpretation • Precision of equipment being used: Limit to how close points can be to one another • Errors become magnified at more detailed map scales • Operator errors: going too fast, fatigue, strained eyesight etc.
Editing attribute values (review) • Adding a field to a table • Editing values in a table • Type in new data “by hand” • Calculating geometry (area, length, perimeter, X, Y) • Calculating field values
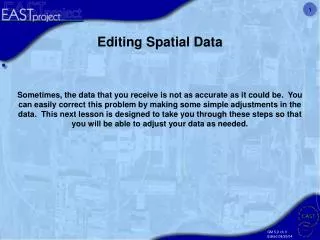
Georeferencing images • Georeferencing: Image registration • Process of aligning a spatial dataset with its correct location in a coordinate system Scanned Mine Map
Process of georeferencing image • Add image to map (unknown location) • Add reference data to map (known location) • Find control points • Check error (RMSE) • Save georeferencing (“rubbersheets” the image)
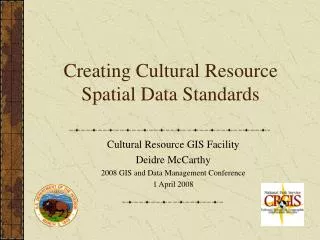
Using control points • Control points are used to register dataset to known location • Use: • Street intersections, corners • Buildings • Other landmarks that do not move Scanned Parcel Map (Unknown) Aerial Photo (Known)
Good control points • Criteria for control points: • Spread evenly around study area • Minimum number of points (at least 4) • Use highest accuracy dataset possible • Use locations identifiable on both datasets (known & unknown) • Final result: • Your image is saved with new georeferencing
Summary • Review: Where do GIS datasets come from? • GPS • Existing data • Digitized data • Heads up digitizing • Editing features • Editing attribute tables • Georeferencing images