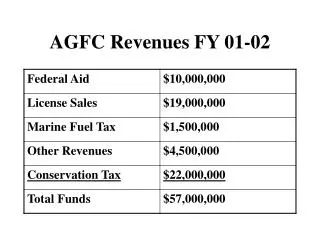
Download
1 / 7
70 likes | 91 Views
Explore California's state revenues in 2001-02, highlighting the importance of different revenue sources over time, such as personal income tax and sales tax. Discover the expansion of business services and construction sectors leading job growth in the 1990s. Learn about the state's booming software industries and the impact of stock market trends on California tax returns.

E N D
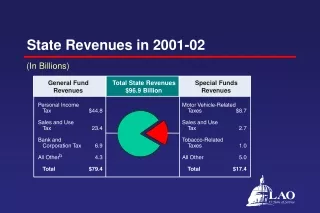
State Revenues in 2001-02 (In Billions) General Fund Total State Revenues Special Funds Revenues $96.9 Billion Revenues
Relative Importance of Different Revenue Sources Over Time General Fund Revenues Personal Income Tax Sales and Use Tax Bank and Corporation Tax All Other 1964-65 2000-01
Strong Personal Income TaxesHave Led Revenue Growth Average Annual Revenue Growth 1994-95 Through 1999-00 Personal Income Growth (6.3 Percent) Personal Income Tax Sales and Use Tax Bank and Corporation Tax Other Revenues 20% 10 15 5
Recent Income Gains Largest at Top End Percent Change in Average Real Income Joint Returns By Quintile1993 Through 1998 50% 40 30 20 10 Bottom 2nd 3rd 4th Top
Business Services and Construction Have Led the 1990’s Expansion Annual Average Percent Change in California Jobs1994 Through 2000 New Jobs All Industries (In Thousands) 3% 550 Business Services 282 Construction Electronics 63 Manufacturing 526 Other Services 448 Trade State and 261 Local Government Finance, Insurance, 60 and Real Estate Nondurable 31 Manufacturing -45 Federal Government -44 Aerospace Total -6 -4 -2 0 2 4 6 8 10% 2,391
The State’s Software Industries Have Boomed During the Decade New Jobs, 1994 to Early 2000 Average Wage in 2000 Computer $96,000 Programming Internet 129,000 88,400 Computer Services Packaged Software 145,400 Computer Systems 105,400 Design Other Software 61,000 Related Activities 10 20 30 40 50 60 70 (Thousands of Jobs)
Stock Market Decline to Moderate Stock Options and Capital Gains Income Included on California Tax Returns(In Billions) $180 Stock Options 160 Capital Gains 140 120 100 80 60 40 20 94 95 96 97 98 99 00 01 02 Forecast