Download
1 / 29
290 likes | 413 Views
Using Open Source to analyze Canada’s National Forest Inventory. Chris West and Brian Low Pacific Forestry Centre Canadian Forest Service Natural Resources Canada. Who we are (1).

E N D
Using Open Source to analyze Canada’s National Forest Inventory. Chris West and Brian Low Pacific Forestry Centre Canadian Forest Service Natural Resources Canada
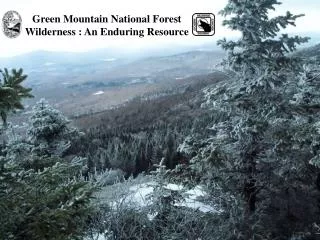
Who we are (1) • Canada’s new National Forest Inventory (NFI) is designed to assess and monitor the extent, state and sustainable development of Canada’s forests.
Who we are (2) • Canada’s National Forest Information System (NFIS Canada) is an inter-governmental initiative that is funded jointly by the Federal, Provincial, and Territorial Governments of Canada. • Working together with its partners, NFIS provides authoritative information/data about sustainable forest management in Canada.
Canada’s Forest Sector Facts • Canada has 10% of the world’s forests. • 41% of Canada’s surface area is forest or other wooded lands. • In 2004, the forest sector contributed $36.8 billion to the Canadian Economy (3.1% of Canada’s GDP) • (Facts taken from “Important Facts on Canada’s Natural Resources” 2005)
FOSS Technologies • Open Source Technologies utilized include: • Mapserver / Proj4. • Linux • Apache • PostgreSQL • PostGIS. • GDAL suite of tools. • GeoTools / JTS • Java / Eclipse
Project Overview • NFI employs a “plot-based design consisting of permanent observational units located on a national grid.” • Repeated measurements are conducted over a set time frame and changes in these plots are summarized and reported over time. • NFI is designed to “be able to provide quantitative information on Canada’s Forests and related resources.”
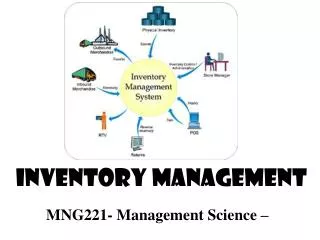
NFI Data • At least 25,000 2km by 2km plots with six layers/themes of data per plot consisting of: • Land Cover photo interpreted (Vector Polygons). • Land Use photo interpreted (Vector Polygons). • Land Ownership photo interpreted (Vector Polygons). • Land Protected Status photo interpreted (Vector Polygons). • Canadian Terrestrial Ecozones (Vector WMS). • Land Cover classified from satellite (Raster).
Spatial Analysis • Required for NFI reporting. • Needs to support area queries at a national level down to queries at a much finer level. • Generally deal with spatial operations that include the “by” or “within” (union or intersection) spatial operands operating on area.
A Sample of NFI Reporting Questions • What is the total forested area within a specified region? • What is the area of forested types within a specified region? • What is the area of forest type by age within a specified region? • What is the area of forest types by protection status within a specified region?
Issues to overcome • Spatial analysis requires thousands upon thousands of spatial overlays. • Mixed raster and vector data make spatial overlays difficult. • Large amounts of attribute data are stored in external databases. • Data collection is conducted over a long period of time, requiring spatial analysis to be done at regular intervals.
General Approach • Load vector NFI spatial data into a Spatial Database (PostGIS). • Resample 2km by 2km NFI plots to 5m by 5m cells (Mapserver, SLD, GDAL, custom code). • Load resampled data into a RDBMS (PostgreSQL). • Run simple SQL queries to generate NFI reports.
Step 1: Load Spatial Data • Load NFI vector plot data into PostGIS. • UTM Zones were created to partition the data • Mapserver used to publish data as raster images (OGC WMS).
Resample plot data (1) • Mapserver is used as a “Vector to raster” engine to create raster images of an NFI plot layer and an NFI plot grid. Each NFI plot has a corresponding “grid file” • A 5m by 5m uniquely colored grid (160,000 cells) was created. • The grid files are aggregated into UTM zones using ogrtindex. The index files are referenced in a Mapfile.
Resample plot data (2) Plot Layer Spatial Data (PostGIS + SLD) Grid Data Mapserver Plot Image Grid Image
Resample plot data (3) • The WMS getmap requests contains the bounding box of 2100 m by 2100 m with a width of 2100 pixels and a height of 2100 pixels. • The request returns a one metre resolution image. • Each 5m by 5m cell in the grid has 25 pixels.
Resample plot data (4) • A service was created to take the images and resample them. • This approach allowed spatial data to be stored in a text file.
Resample plot data (5) • Simple Overlay example with two four pixel images: Image 1 Image 2 1,0 0,0 0,0 1,0 Overlay 0,1 0,1 1,1 1,1 Output file red, green, 2 blue, black, 1 blue, yellow, 1
Resample plot data (6) • The output CSV file is resampled to find the highest number of pixels for each grid cell. The resulting document contains 160,000 rows (one for each 5m by 5m cell) consisting of each resampled colour pair. • The colour representing the plot layer in each record is replaced by its unique polygon identifier.
5m 5m Example of Resampling Grid Image (5X5 pixels) Land cover Image (5X5 pixels) Raster Overlay green,blue,10 green,yellow,7 green,pink,8 Output file
Resampled 5X5 Cell Raster Overlay Output green,blue,10 green,yellow,7 green,pink,8 Resampling Process green,blue
Load Resampled data intoPostgreSQL • Resampled data gets loaded into one table in PostgreSQL.
SQL Queries to Generate NFIReports • Because the spatial data and the attribute data are both located in a RDBMS, SQL queries can be written to handle the “by” and “within” spatial operands.
Example Cell SummariesGeneration Query • The SQL statement adds the following records in the CELL_SUMMARIES table: SELECT DISTINCT 'plot1_pelo' as TILE_THEME_ID, c1.theme_value c2.theme_value c3.theme_value c4.theme_value as THEME_VALUE, count(*) as VALUE_COUNT FROM cell_values c1, cell_values c2, cell_values c3, cell_values c4 WHERE c1.tile_theme_id = 'plot1_landcover' AND c2.tile_theme_id = 'plot1_landuse' AND c3.tile_theme_id = 'plot1_ownership' AND c4.tile_theme_id = 'plot1_protectedstatus' AND c1.cell_num = c2.cell_num AND c2.cell_num = c3.cell_num AND c3.cell_num = c4.cell_num GROUP BY c1.theme_value,c2.theme_value,c3.theme_value,c4.theme_value;
Sample Output • Sample output from query.
Why this Approach • Allows the combination of vector and raster data to be spatially analyzed. • Allows user to do spatial queries using SQL. • Utilizes the power of a RDBMS. • Allows spatial data to be easily joined (SQL) to attribute data. • Easily scalable because open source software is used.
Acknowledgments • Canadian Council of Forest Ministers (CCFM) • Canadian Forest Service, Natural Resources Canada (CFS, NRCan) • National Forest Inventory staff including: • Mark Gillis • Katja Power • Alex Song • Past Contributors: • Robin Quenet • Rick Morrison
References • Low , B. (2005). ExPAND Expanding Primary Attributes for National Decision Making, M.Sc. Thesis University of Victoria. • Gillis et al. (2004). About NFI. <https://nfi.nfis.org/about_nfi/index_e.shtml> • Natural Resources Canada (2005). Important Facts on Canada’s Resources.