Download
1 / 32
320 likes | 464 Views
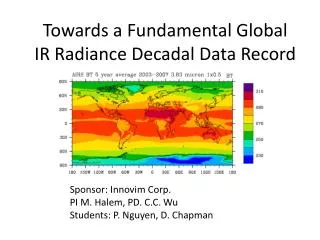
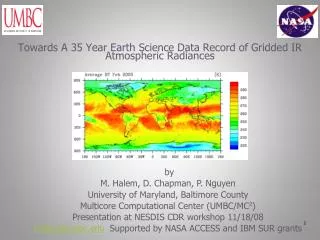
Towards A 35 Year Earth Science Data Record of Gridded IR Atmospheric Radiances. by M. Halem, D. Chapman, P. Nguyen University of Maryland, Baltimore County Multicore Computational Center (UMBC/MC 2 ) Presentation at NESDIS CDR workshop 11/18/08

E N D
Towards A 35 Year Earth Science Data Record of Gridded IR Atmospheric Radiances by M. Halem, D. Chapman, P. Nguyen University of Maryland, Baltimore County Multicore Computational Center (UMBC/MC2) Presentation at NESDIS CDR workshop 11/18/08 halem@umbc.edu Supported by NASA ACCESS and IBM SUR grants
Overview • Motivation • SOAR gridding system • Spatial observation based geo-location gridding system • Hadoop cloud computing processing approach • Neural network approach for orbit/SRF adjustments • MODIS & AIRS long term IR radiance comparisons • Climate Applications • Summary
Motivation http://www-airs.jpl.nasa.gov/Technology/HistoricalContext/ • NASA, NOAA DOD and ESA have collected large volumes (Petabytes) of satellite Infrared Radiance (IR) data for the past 39 years which are stored in various archives and formats and on different storage media. • Gridded data records of Level 1B IR measurements for AIRS/HIRS/VTPR/SIRS and MODIS/AVHRR data have many advantages for climate studies but are not available today as products • The basis of our approach to forming a HIRS/AVHRR gridded FCDR is to calibrate against AIRS/MODIS which is expected to be operational until 2013. If AIRS/MODIS instruments continue to operate, we show this data can be a Fundamental Decadal Data Record (FDDR) • AIRS is hyperspectral with 2378 channels spanning 3.7um to 15.4 um ~14km and 4 Vis channels at 0.41 - 0.44 μm, 0.58 - 0.68 μm, 0.71 - 0.92 μm and 0.49 - 0.94 μm at ~1km. AVHRR overlap are 0.58 - 0.68 and0.725 - 1.00um. • MODIS is hyperspatial with 16 IR spectral bands 3.6 um 14.3 um at 1km and 20 Vis channels several corresponding to AVHRR.
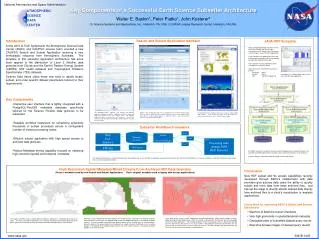
Service Oriented Atmospheric Radiances (SOAR) • Developed a web based system with an interface for accessing and invoking gridding and analysis services on level 1B Infra-red radiance data • Employs SOA technologies to discover and select services for use with multi -sensor infra-red radiances on UMBC/MC2 cluster • Serves up gridded (lat-lon) AIRS and MODIS IR spectral radiances on-demand and being extended to serve up HIRS/AVHRR and requested images and/or structured data formats • Provides a multi instrument framework that precisely accounts for the scanned radiances emitted from each grid cell using the instruments own spatial response function • Provides a platform for users to exploit historical IR data for generating climate analysis with tools from traditional methodologies
SOAR Web-based System http://bluegrit.cs.umbc.edu/soarID: soar Pwd:soar1234! • SOAR system provides: • 6 +years AIRS IR global pre-gridded at 0.50x1.00 and processing 4 Vis channels at 0.1250 x 0.250 km res • 3+ years of non-continuous MODIS gridded datasets • User request of subsets, arbitrary regions resolutions, visualizations, structured data sets, statistical routines, for selected channels • -------------------------------------------------------------- Under beta test development: release 2/1/09 • IR gridded datasets from multiple sensors AIRS/HIRS and MODIS/AVHRR on demand for arbitrary grid resolutions • Gridding algorithm employs a spatial ray casting scan angle adjustment for zenith angle dependence and neural networks for orbital and spectral function response adjustments. • Serves up anomalies, MJOs and OLR products on demand.
Why we use SOAR Maps arbitrary level 1B granules onto level 3 grids with desired statistics. Advantages: Gridding greatly reduces data volume (lossy compression) Provides analysis services based directly on observations Contains a spatial raycasting framework (Gridder) for mapping multi instrument obs accurately onto grids Uses highly efficient parallel computing paradigm, Hadoop. No level 3 gridded radiance products available for AIRS/HIRS and MODIS/AVHRR instrument teams Increases usability by scientists (modeling & visualization climate analysis studies, etc.)
SOARs Generic Gridder • Philosophy: Common gridding algorithms for many instruments. • Spatial calibration with recursive ray casting algorithm • Spectral calibration with neural network algorithm. • Framework developed for gridding many radiative scanning instruments. • Currently implemented for AIRS, MODIS, AIRS Visible • Being extended to HIRS3, HIRS4 and AVHRR • Incorporating artificial neural network algorithm into Gridder.
Radiances travelling from Earth to instrument are weighted by the sensor's spatial response function. The shape and distribution of the footprint can be calculated by projecting the spatial response function onto Earth Actual observation is a weighted sum, IE integral, of all radiation from the footprint
(a) through (d) are simplified examples of spatial response functions (a) uniform response function, similar to AIRS (b) triangular response function, similar to MODIS (c) ideal Gaussian response function (d) arbitrary response function
Determine what percentage of a footprint lies in a grid cell. Given: the footprint is a distribution of spatial response Thus, we must integrate the footprint within the grid cell. Numerical integration allows this technique to be used with any spatial response function. Algorithm: Footprint is recursively subdivided until it is completely within a gridcell. Raycasting is used in recursion to geolocate points.
Images between -90 and -80 degree latitudinal band Corrects errors caused by lat-lon singularities.(a) Missing data (blue) over most of the south pole(b) South pole correctly gridded with numerical footprint
AIRS OLR at 0.5x1 Lat Lon grid 12 micron window channel: Errors up to or exceeding 1K BT are corrected from all over the planet. The global daily average is corrected by 0.3K BT.
Neural Networks Neural networks are algorithms used for either classification or function approximation A commonly used type of neural network is the Multi-Layer Perceptron, of which Kalman filters are one type A neural network with x input nodes, one hidden layer with y hidden nodes and z output nodes In supervised mode, time series of several spectral bands per data sample presented to the network and desired output is used to modify the weights so that the deviation between actual and obtained output is minimized. main drawback is they require experience in selecting values for the numerous parameters that need to be set
The Generic Gridder • Issues: • Cannot readily obtain spatial response functions for most instruments. • Implicit approximations (circle, triangle, etc) can be used, and well documented • Missing documentation HIRS3 spectral multiplier • Last resort use neural network to solve for missing constant • Compare HIRS to known data to “calibrate” the missing constant
AIRS/MODIS comparison GREEN are AIRS observations RED are MODIS observations • AIRS/MODIS Brightness Temperatures for OCT. 1, 2007 at 0.5ox1o • Consistent stable instrument measurements after 6+ years! • Avg differences between MODIS and AIRS are ~1 K. Many channels show agreement of ~ 0.1 K Difference between MODIS & MODIS convolved with AIRS
Feb 2005 anomaly Feb 2007 anomaly Feb 2006 anomaly AIRS Monthly anomaly 0.5ox1o at 12.18 µm • Year to year variances • Cold radiances Feb 05(strong El Nino year) convective cloud, Warm radiances Feb 07 cloud clear surface in Western Pacific • Similar in Indian Ocean and West Pacific area • Feb 05 warmer than other 2 year in East US (hurricanes) • Variances in Intertropical Convergence Zone
MJO- results Jan1707 Jan1507 Jan1307 Jan1107 B) Jan0907 Variances color code Jan0707 The first EOF explaining about 14.3% variance Jan0507 BT color code Jan0307 Jan0107 Dec2906 Dec2706 lag5 Dec2506 lag4 Dec2306 lag3 lag2 Dec2106 lag1 Dec1906 Variances color code Dec1706 C) Dec1506 A) The extended EOF which captures the dynamics using a temporal lag of 2 day running mean. 2 day running mean of MODIS channel 32 (Surface/Cloud Temperature) at 0.5ox1 11.7 µm -12.2 µm 5S-5N 0-180E Brightness Temperature descending orbit from Dec 15 2006 to Jan 17 2007.
AIRS/MODIS total OLR 0.5ox1o • AIRS/MODIS total OLR isentropic assumption • Compare with CERES/Erbe OLR
AIRS/MODIS Aqua total OLR 0.5ox1o AIRS, MODIS Feb. 2005 global average 230, 233 W/m2 respectively
Summary • Moving towards implementing an FCDR of gridded HIRS & AVHRR data sets in the next few months • SOAR system provides precise mult-instrument spatial gridding options for generating arbitrary spatial/spectral level 3 radiance resolutions • Relative AIRS and MODIS IR spectral radiance measurements have not degraded in over six years and have potential to provide long term (>10 year) Fundamental Climate Data Record • Leverages off AIRS and MODIS to train Neural net to maintain consistency across HIRS and AVHRR platforms • Employs an extremely efficient parallel computing paradigm to conduct data intensive processing and reprocessing • Incorporates a variety of instrument science analysis products as services • Tracking MJO directly from calibrated observations indicates fewer uncertainties for climate inference compared with MJO anomaly exploited from reanalysis • Work supported by NASA ACCESS grant and IBM SUR grant