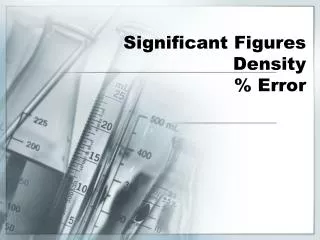
Significant Figures and Density
Significant Figures and Density. General Chemistry 101/102 Laboratory Manual University of North Carolina at Wilmington. Purpose. To gain an understanding of how to interpret uncertainties in laboratory data. To become familiar with the use of common laboratory equipment and glassware.

Significant Figures and Density
E N D
Presentation Transcript
Significant Figures and Density General Chemistry 101/102Laboratory ManualUniversity of North Carolina at Wilmington
Purpose • To gain an understanding of how to interpret uncertainties in laboratory data. • To become familiar with the use of common laboratory equipment and glassware. • Safety Considerations • There are no special safety considerations associated with this laboratory exercise other than washing your hands before leaving the lab. Significant Figures and Density
Accuracy vs. Precision • Accuracy – a statement of how close a measured value is to the true or accepted value. • Precision – a statement of how reproducible the measured results are. Significant Figures and Density
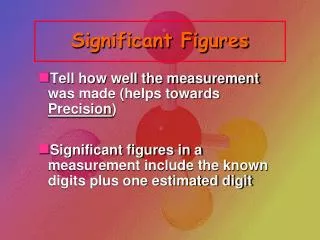
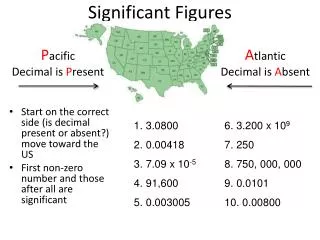
Significant Figures • The value reported for a measurement is rounded off so that it contains only the digits known with certainty plus one uncertain one which is the last digit. • Significant Figure Rules • To determine the number of significant figures in a reported value, start at the left and count all digits beginning with the first non-zero digit. Examples: 0.003040 => 4 sig. fig. 10,200 => 5 sig. fig. Significant Figures and Density
Example: 12.0035 g 3.72 g 0.015 g (4 decimal places) (2 decimal places) (3 decimal places) 15.74 g (2 decimal places) Significant Figures and Density • Significant Figures in Calculations • Addition & Subtraction: The number of decimal places in the answer should be equal to the number of decimal places in the value with the fewest decimal places.
Significant Figures in Calculations • Multiplication & Division: The number of significant figures in the answer should be the same as the value with the fewest significant figures. Example: 12.36 mL x 1.7 g = 21 g mL 4 sig. fig. 2 sig. fig. 2 sig. fig. • Note: Definitions and counted numbers have an unlimited number of significant figures. Significant Figures and Density
Significant Figures and Density • Procedure – Part 1 a & b • Pour approximately 8 mL of water into a 50 mL graduated cylinder. Record the measured volume to the appropriate number of significant figures. Repeat the procedure using a 10 mL graduate cylinder. read from the bottom of the meniscus
Significant Figures and Density • Procedure – Part 1 c & d • Use a 10 mL graduated pipet to transfer 8 mL of water to a 50 mL preweighed beaker. Reweigh the beaker and use the mass of water and the density of water to calculate the volume of water transferred.
Significant Figures and Density • Procedure – Part 2 • Determine the identity of an unknown metal by measuring its density (mass/volume). The volume of the metal is determined by “displacement”.
Significant Figures and Density • Procedure – Part 2 the difference between these two readings is the volume of the metal