Download
1 / 12
120 likes | 256 Views
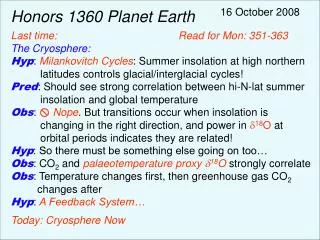
16 October 2008. Honors 1360 Planet Earth Last time: The Cryosphere: Hyp : Milankovitch Cycles : Summer insolation at high northern latitudes controls glacial/interglacial cycles! Pred : Should see strong correlation between hi-N-lat summer

E N D
16 October 2008 Honors 1360 Planet Earth Last time: The Cryosphere: Hyp: Milankovitch Cycles: Summer insolation at high northern latitudes controls glacial/interglacial cycles! Pred: Should see strong correlation between hi-N-lat summer insolation and global temperature Obs: Nope. But transitions occur when insolation is changing in the right direction, and power in 18O at orbital periods indicates they are related! Hyp: So there must be something else going on too… Obs: CO2 and palaeotemperature proxy 18O strongly correlate Obs: Temperature changes first, then greenhouse gas CO2 changes after Hyp: A Feedback System… Today:Cryosphere Now Read for Mon: 351-363
Hansen et al. PNAS 2006 concludes “Global mean temperature in 2005 was the warmest in 120,000 years”… Mann et al.,Eos 2003 concludes four different palaeo- temperature proxies are in general agreement (but with large uncertainties)
Because of feedbacks, small changes in input (solar) lead to large changes in the system state: Bio-CO2 (+) Ice Albedo (+) Earth Climate System Solar Energy Bio-SO2 (+) In chaos/system theory, like Lorenz’ butterfly effect… Earth climate history for the past 2 Myrs suggests two stable points (glacial, interglacial) with unstable transitions
Minimum sea level in Pleistocene ~ 100-120 m below present Maximum sea level in Eocene (50 Mya) ~ 100-140 m above present Temperatures during early Eocene ~ 7 degrees above present CO2 during Eocene ~2000 ppm (currently ~385 ppm) Some Perspective:
The Cryosphere Now… Cryosphere = ice caps + alpine glaciers + snow + sea ice
The modern cryosphere is monitored from satellites! (reflected radar images, reflected laser heights, gravity measurements) This plus measurements from ground and airplanes gives pretty good estimates of changes…
Antarctic Sea Ice remains very consistent with the past … Arctic Sea Ice is finding a “new normal’; Arctic summers may be ice-free in 5-15 years
GRACE gravity data over Greenland: O N D J F M • → 239 km3 per • year since 2002, • mostly from the • east coastal • areas • 0.6 mm/yr of sea level change A M J J A S
GRACE (gravity) measurements of ice mass change in Antarctica → 152 km3 per year from 2002-2006, mostly from West Antarctica But sped up to ~ Greenland rates after that
Alpine Glaciers Glacier Bay National Park, Alaska
6000 cubic km total reduction in alpine glacier ice in 45 years = 1.7 cm sea level change (0.4 mm/yr)
Global sea ice coverage dropping ~3% per decade: No direct effect on global cryosphere budget, BUT… Snow extent also dropping ~4% per decade