GADPH
40 likes | 214 Views
A. 8. 7. 6. 5. 4. 3. PI3 mRNA relative expression. 2. 1. 0. -1. PA-1. ES-2. OV90. PEO4. MCAS. A2780. SW626. CaOV3. Hey-A8. SKOV3. IGROV1. TOV21G. OVCAR5. OVCAR8. OVCAR3. TOV112D. OVCA429. OVCA432. OVCA433. OVCA420. -2. C. D. B. 20000. 37 kDa. GADPH. 16000.

GADPH
E N D
Presentation Transcript
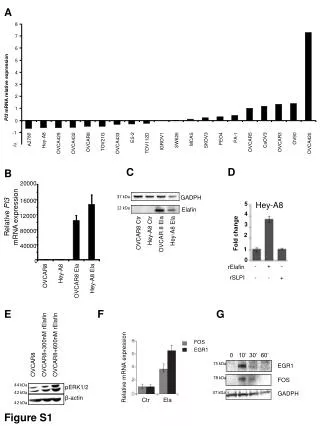
A 8 7 6 5 4 3 PI3 mRNA relative expression 2 1 0 -1 PA-1 ES-2 OV90 PEO4 MCAS A2780 SW626 CaOV3 Hey-A8 SKOV3 IGROV1 TOV21G OVCAR5 OVCAR8 OVCAR3 TOV112D OVCA429 OVCA432 OVCA433 OVCA420 -2 C D B 20000 37 kDa GADPH 16000 Hey-A8 5 12 kDa Elafin Relative PI3 mRNA expression 4 12000 3 Hey-A8 Ctr Hey-A8 Ela 80000 Fold change OVCAR8 Ctr OVCAR 8 Ela 2 40000 1 0 0 - + - rElafin Hey-A8 - - + rSLPI OVCAR8 Hey-A8 Ela OVCAR8 Ela E F G FOS OVCAR8+300nM rElafin OVCAR8+600nM rElafin EGR1 0 10’ 30’ 60’ 75 kDa OVCAR8 EGR1 Relative mRNA expression 78 kDa FOS 44 kDa pERK1/2 42 kDa 37 kDa GADPH β-actin Ctr Ela 42 kDa Figure S1
BLBC cell line HGSOC cell line BT549 OVCAR8 -rElafin +rElafin -rElafin +rElafin Lysis and Digestion iTRAQ 114 iTRAQ 115 iTRAQ 116 iTRAQ 117 Chemical Labeling Phosphopeptide enrichment 3D-RP-SAX-RP Figure S2
A WFDC2 203892_at B C PI3 203691_at PI3 41469_at Figure S3
A B MDA-MB-468 MDA-MB-468 OVCAR5 HCC1954 HCC1143 OVCAR5 BT549 MCF7 T47D MCF7 T47D Elafin Elafin 12 kDa 12 kDa GADPH 37 kDa CM WCE C D HCC1954 MDA-MB-468 1.2 1.2 1 1 MDA-MB-468+NTPsi MDA-MB-468+PI3si HCC1954+NTPsi 0.8 HCC1954+PI3si 0.8 Proliferation 0.6 0.6 0.4 0.4 PI3 100 bp 0.2 0.2 GADPH 100 bp 0 0 PI3si PI3si RT-PCR NTPsi NTPsi Figure S4