Insights from The Cod Day: North Sea and West of Scotland Cod Management (1st Oct 2013)
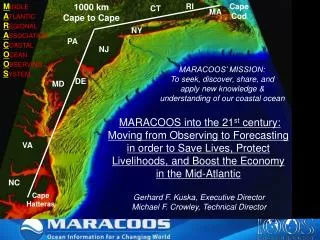
On October 1, 2013, The Cod Day at the Marine Laboratory presented crucial discussions on North Sea and West of Scotland cod management. The agenda included ICES advice for the fishery, catch forecasts and implications, population structure, and the impact of the IBTS survey. Key recommendations highlighted the need for minimized bycatch, assured landings, and addressing high mortality rates within the cod stocks. The event focused on the importance of assessing the Spawning Stock Biomass (SSB) effectively to guide sustainable management practices for cod fisheries.

Insights from The Cod Day: North Sea and West of Scotland Cod Management (1st Oct 2013)
E N D
Presentation Transcript
The Cod Day The Cod Day, Marine Laboratory, 1st October 2013
Timetable • 11:00 • ICES advice (July 2013) for North Sea and West of Scotland cod • The third-quarter IBTS survey • When to measure SSB for the North Sea cod management plan? (Coby Needle, MSS) • 12:00 • Exploring the catch forecast – options and implications (Carl O’Brien, CEFAS) • 13:00 • Lunch • 13:30 • West coast discussion • 14:30 • Cod population structure (Peter Wright, MSS) • 14:45 • Sum up and close
ICES advice for North Sea and West of Scotland cod: July 2013 Dr Coby Needle Marine Laboratory, Aberdeen The Cod Day, Marine Laboratory, 1st October 2013
North Sea cod • Assumed to be no unaccounted removals since 2006 • F low and falling, SSB low and rising, long run of low recruitment
North Sea cod • Discarding remains high, although rates for older fish are lower than in recent years.
North Sea cod • Now in the “long-term” phase of the management plan: • Assume F(2013) = F(2012): “no reduction in effort ceilings” • Target F(2014) determined by rule = 0.21 • TAC constraint ±20% Target F F(2014) = 0.21 B(2013) = 72 kt B(lim) B(pa) SSB
North Sea cod • Summary text: • “ICES advises on the basis of the EU–Norway management plan that landings in 2014 should be no more than 28 809 tonnes. If discards rates do not change from those in 2012, this implies catches of no more than 37 496 tonnes.” • F low and falling, SSB low and rising • BUT long run of low recruitment • AND adult stock currently concentrated in the main fishing areas for Scotland
West of Scotland cod • F remains high • SSB remains low • Long run of low recruitment
West of Scotland cod • Discarding remains high • Discard mortality higher than landings mortality
West of Scotland cod • Summary text: • “ICES advises on the basis of the MSY approach that there should be no directed fisheries and that bycatch and discards should be minimized.” • Management measures have not constrained catches • F remains high • SSB very low • Impaired recruitment
The 3rd-quarter IBTS survey: its effect and why it isn’t currently used Dr Coby Needle Marine Laboratory, Aberdeen The Cod Day, Marine Laboratory, 1st October 2013
IBTS surveys • Multinational surveys coordinated by ICES • Two surveys: 1st and 3rd quarters • Since 2011, the North Sea cod assessment has only used IBTS Q1. • Two main questions: • What effect did IBTS Q3 have on the assessment in 2011? • Why is it no longer used?
The effect of IBTS Q3 • Two assessments carried out using catch data and either one of the IBTS surveys • IBTS Q1 indicated declining or stable mortality rates (F) • IBTS Q3 indicated increasing mortality rates (F) Source: ICES WGNSSK (2010)
The effect of IBTS Q3 • Two assessments carried out using catch data and either one of the IBTS surveys • IBTS Q1 indicated declining or stable mortality rates (F) • IBTS Q3 indicated increasing mortality rates (F) • Significant difference • Indication from IBTS Q3 contradicted widespread perceptions of a reduction in fishing activity on cod. • Further analysis was called for…
IBTS Q3 catchability • Several papers at WKCOD analysed IBTS Q3 catchability. • Findings: • Analysis of how survey indices change between quarters and through years suggests that the catchability of IBTS Q3 has increased in recent years • That is: IBTS Q3 “sees” comparatively more cod in recent years than IBTS Q1, or than IBTS Q3 in earlier years (up to 60% more) • But this leads to an indication of higher fishing mortality • No valid explanation for the effect
Conclusions • WKCOD concluded that IBTS Q1 is more likely to reflect true stock size: • No observed change in catchability for IBTS Q1 so deemed more reliable • Observed changes in catchability for IBTS Q3 so deemed less reliable • Hence assessment now based on IBTS Q1 and catch data only. • Unlikely to be changed before next benchmark • Scheduled 2015
When to measure SSB in the cod management plan? Dr Coby Needle Marine Laboratory, Aberdeen The Cod Day, Marine Laboratory, 1st October 2013
Measuring SSB • The current cod management plan bases decisions on: • “the size of the stock on 1 January of the year prior to the year of application of the TACs” • e.g. For advice produced in July 2013, this would be 1 January 2013 • Less uncertainty • But no account of the fishery in 2013, or the forecasted fishery in 2014
Measuring SSB • Other management plans (e.g. for several haddock stocks) use: • “the SSB in the end of the year in which the TAC is applied” • e.g. For advice produced in 2013, this would be 1 January 2015 • More uncertainty • But does account for fishery during 2013 and 2014 • Difference can be significant • Cod MP was evaluated assuming SSB at start of year prior to quota year • Can’t be changed without re-evaluation of MP
Cod populations around the UK Dr Peter Wright Marine Laboratory, Aberdeen The Cod Day, Marine Laboratory, 1st October 2013
Genetic and tagging evidence for populations 3 genetically differentiated populations around the UK Adult cod do not range across stock regions
Genetic and tagging evidence for populations Viking centred group never leaves cool, deep waters Adults mostly found close to release sites near spawning Some exchange during feeding
Sub-population dynamics: local SSB Sub-areas Index based on 1st quarter IBTS & SGFS WESTCOAST p <0.001 p <0.01 NORTH SEA > decline of coastal units NW S NE p <0.001 Holmes, Wright & Fryer, 2008 ICES JMS, 65: 206-215
Cod mature and grow at different rates Higher and more variable growth in the south Slower growth and larger size at maturity in NE Wright, Millar & Gibb (2011), ICESJMS, 68, 1918-27
Uncertainty over extent of NE cod cod have same Lp50 as NE cod cod have same Lp50 as NW cod New FISA starting soon to estimate boundaries
North / south split in stock trends from surveys • From IBTS survey index: • Difference in the north: • 277% for age 2 • 257% for age 3+ • Difference in the south: • 93% for age 2 • 152% for age 3+ • Vessels fishing in the north are likely to have seen a much greater increase in the cod stock than vessels fishing in the south 2006 2013 Age 2 Age 3+
West coast management discussions The Cod Day, Marine Laboratory, 1st October 2013