Download
1 / 13
130 likes | 218 Views
This chapter covers the basics of the Internet, exploring packet transmission delays, queueing, loss, and protocol layers. Learn how networks handle data and potential security risks.

E N D
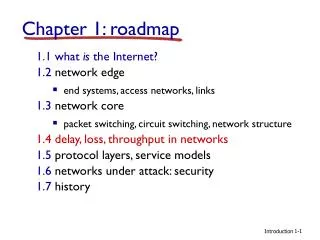
Chapter 1: roadmap 1.1 what is the Internet? 1.2 network edge • end systems, access networks, links 1.3 network core • packet switching, circuit switching, network structure 1.4 delay, loss, throughput in networks 1.5 protocol layers, service models 1.6 networks under attack: security 1.7 history 1-1 Introduction
packet being transmitted (delay) packets queueing(delay) free (available) buffers: arriving packets dropped (loss) if no free buffers How do loss and delay occur? packets queue in router buffers • packet arrival rate to link (temporarily) exceeds output link capacity • packets queue, wait for turn A B 1-2 Introduction
Four sources of packet delay transmission A propagation B nodal processing queueing dnodal = dproc + dqueue + dtrans + dprop dproc: nodal processing • check bit errors • determine output link • typically < msec dqueue: queueing delay • time waiting at output link for transmission • depends on congestion level of router 1-3 Introduction
dtrans and dprop very different Four sources of packet delay transmission A propagation B nodal processing queueing dnodal = dproc + dqueue + dtrans + dprop dprop: propagation delay: • d: length of physical link • s: propagation speed in medium (~2x10⁸ m/sec) • dprop = d/s dtrans: transmission delay: • L: packet length (bits) • R: link bandwidth (bps) • dtrans= L/R * Check out the Java applet for an interactive animation on trans vs. prop delay 1-4 Introduction
Caravan analogy 100 km 100 km ten-car caravan toll booth toll booth • cars “propagate” at 100 km/hr • toll booth takes 12 sec to service car (bit transmission time) • car~bit; caravan ~ packet • Q: How long until caravan is lined up before 2nd toll booth? • time to “push” entire caravan through toll booth onto highway = 12*10 = 120 sec • time for last car to propagate from 1st to 2nd toll both: 100km/(100km/hr)= 1 hr • A: 62 minutes 1-5 Introduction
100 km 100 km ten-car caravan toll booth toll booth Caravan analogy (more) • suppose cars now “propagate” at 1000 km/hr • and suppose toll booth now takes one min to service a car • Q: Will cars arrive to 2nd booth before all cars serviced at first booth? • A: Yes! after 7 min, 1st car arrives at second booth; three cars still at 1st booth. 1-6 Introduction
Queueing delay (revisited) average queueing delay • R: link bandwidth (bps) • L: packet length (bits) • a: average packet arrival rate traffic intensity = La/R • La/R ~ 0: avg. queueing delay small • La/R -> 1: avg. queueing delay large • La/R > 1: more “work” arriving than can be serviced, average delay infinite! La/R ~ 0 La/R -> 1 * Check out the Java applet for an interactive animation on queuing and loss 1-7 Introduction
“Real” Internet delays and routes • what do “real” Internet delay & loss look like? • traceroute program: provides delay measurement from source to router along end-end Internet path towards destination. For all i: • sends three packets that will reach router i on path towards destination • router i will return packets to sender • sender times interval between transmission and reply. 3 probes 3 probes 3 probes 1-8 Introduction
“Real” Internet delays, routes traceroute: gaia.cs.umass.edu to www.eurecom.fr 3 delay measurements from gaia.cs.umass.edu to cs-gw.cs.umass.edu 1 cs-gw (128.119.240.254) 1 ms 1 ms 2 ms 2 border1-rt-fa5-1-0.gw.umass.edu (128.119.3.145) 1 ms 1 ms 2 ms 3 cht-vbns.gw.umass.edu (128.119.3.130) 6 ms 5 ms 5 ms 4 jn1-at1-0-0-19.wor.vbns.net (204.147.132.129) 16 ms 11 ms 13 ms 5 jn1-so7-0-0-0.wae.vbns.net (204.147.136.136) 21 ms 18 ms 18 ms 6 abilene-vbns.abilene.ucaid.edu (198.32.11.9) 22 ms 18 ms 22 ms 7 nycm-wash.abilene.ucaid.edu (198.32.8.46) 22 ms 22 ms 22 ms 8 62.40.103.253 (62.40.103.253) 104 ms 109 ms 106 ms 9 de2-1.de1.de.geant.net (62.40.96.129) 109 ms 102 ms 104 ms 10 de.fr1.fr.geant.net (62.40.96.50) 113 ms 121 ms 114 ms 11 renater-gw.fr1.fr.geant.net (62.40.103.54) 112 ms 114 ms 112 ms 12 nio-n2.cssi.renater.fr (193.51.206.13) 111 ms 114 ms 116 ms 13 nice.cssi.renater.fr (195.220.98.102) 123 ms 125 ms 124 ms 14 r3t2-nice.cssi.renater.fr (195.220.98.110) 126 ms 126 ms 124 ms 15 eurecom-valbonne.r3t2.ft.net (193.48.50.54) 135 ms 128 ms 133 ms 16 194.214.211.25 (194.214.211.25) 126 ms 128 ms 126 ms 17 * * * 18 * * * 19 fantasia.eurecom.fr (193.55.113.142) 132 ms 128 ms 136ms trans-oceanic link * means no response (probe lost, router not replying) * Do some traceroutes from exotic countries at www.traceroute.org 1-9 Introduction
Packet loss • queue (aka buffer) preceding link in buffer has finite capacity • packet arriving to full queue dropped (aka lost) • lost packet may be retransmitted by previous node, by source end system, or not at all buffer (waiting area) packet being transmitted A B packet arriving to full buffer is lost * Check out the Java applet for an interactive animation on queuing and loss 1-10 Introduction
pipe that can carry fluid at rate Rsbits/sec) pipe that can carry fluid at rate Rcbits/sec) server sends bits (fluid) into pipe Throughput • throughput: rate (bits/time unit) at which bits transferred between sender/receiver • instantaneous: rate at given point in time • average: rate over longer period of time link capacity Rsbits/sec server, with file of F bits to send to client link capacity Rcbits/sec 1-11 Introduction
Rcbits/sec Rsbits/sec Rcbits/sec bottleneck link link on end-end path that constrains end-end throughput Throughput (more) • Rs < RcWhat is average end-end throughput? Rsbits/sec • Rs > RcWhat is average end-end throughput? 1-12 Introduction
Throughput: Internet scenario • per-connection end-end throughput: min(Rc,Rs,R/10) • in practice: Rc or Rs is often bottleneck Rs Rs Rs R Rc Rc Rc 10 connections (fairly) share backbone bottleneck link Rbits/sec 1-13 Introduction


