Download
1 / 75
750 likes | 961 Views
ATMO 336 Climate, Weather and Society Lecture Atmospheric Composition Temperature, Density, Pressure Vertical Structure Weather vs. Climate. Atmospheric Composition Permanent Gases. N 2 and O 2 are most abundant gases Percentages hold constant up to 80 km

E N D
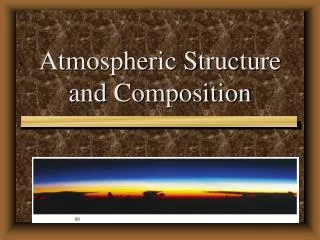
ATMO 336Climate, Weather and Society LectureAtmospheric CompositionTemperature, Density, PressureVertical Structure Weather vs. Climate
Atmospheric CompositionPermanent Gases • N2 and O2 are most abundant gases • Percentages hold constant up to 80 km • Ar, Ne, He, and Xe are chemically inert • N2 and O2 are chemically active, removed & returned Ahrens, Table 1.1, 3rd Ed.
N2 and O2 N2 Boiling point: 77 K or -196°C or –320 °F O2 Boiling point: 90 K or -183 °C or -297 °F Balance between input (production) and output (destruction): Input: plant/animal decaying Sink: soil bacteria; oceanic plankton-->nutrients Input: plant photosynthesis Sink: organic matter decay chemical combination (oxidation) breathing
Atmospheric CompositionImportant Trace Gases Ahrens, Table 1.1, 3rd ed. Which of these is now wrong even in the 4th edition of Ahrens?
Carbon Dioxide CO2 • Sources • vegetative decay • volcanic eruptions • animal exhalation • combustion of fossil fuels(CH4 + 2 O2 > 2 H2O + CO2) • Sinks • photosynthesis (oxygen production) • dissolves in water • phytoplankton absorption (limestone formation)
CO2 Trend “Keeling Curve” Some gases vary by season and over many years. The CO2 trend is the cause for concern about global warming. CO2 increases in northern spring, decreases in northern fall http://earthguide.ucsd.edu/globalchange/keeling_curve/01.html
H2O Vapor VariabilityPrecipitable Water (mm) Some gases can vary spatially and daily
Aerosols 1 cm3 of air can contain as many as 200,000 non-gaseous particles. • dust • dirt (soil) • salt from ocean spray • volcanic ash • water • pollen • pollutants
Aerosols - Volcanic Ash Fig. 1-4, p.6
Aerosols - Dust Particles Dust Storm on Interstate 10, between Phoenix and Tucson, AZ.
Aerosols • Provide surfaces upon which water vapor can condense. • Provide a surface area or catalyst needed for much atmospheric chemistry. • Aerosols can deplete stratospheric ozone. They can also cool the planet by reflecting sunlight back to space.
Scientific Notation How do we write very big or very small number? Scientific Notation is the way that scientists compactly write very large or small numbers It can be thought of as a coefficient times ten raised to an exponent
Scientific Notation Speed of light is 300,000 meters per second (m s-1) Scientific Notation for speed of light is 3.0 x 10⁵ m s-1 Wavelength of visible light is close to 0.0000005 meters Scientific Notation for wavelength would be 5.0 x 10⁻⁷ m s-1
Scientific Notation Example… Distance between the Earth and the Sun is 150,000,000 kilometers Scientific Notation for distance would be?
Scientific Notation Example… Distance between the Earth and the Sun is 150,000,000 kilometers Scientific Notation for distance would be? 1.5 x 10⁸ km
Fundamental Concepts Let us introduce three fundamental concepts... Temperature Density Pressure
Temperature Scales • Fahrenheit (oF) - relative US public standard • Celsius (oC)- relative Freezing point 0oC Boiling point 100oC oC= 5/9 (oF-32) • Kelvin (K)- absolute K= oC+273 Ahrens p27
What is Temperature? Microscopic View Energy due to random jiggling of molecules Related to average molecular speed (v);500 m/s for air at room temperature Maxwell Distribution K.E.=(1/2)mv2=(3/2)kT m = mass of one molecule k = Boltzmann constant =1.38065×10⁻²³ joule/K (joule is unit of energy)
Hypothermia Condition in which the internal temperature drops below that required for normal metabolism and bodily functions. Hyperthermia Condition in which the internal temperature rises above threshold that leads to organ failure. Impact of Extreme Temperatures on Humans
Hypothermia Stages • Stage 1 http://en.wikipedia.org/wiki/Hypothermia • Body temperature drops by 1-2C (Normal body temperature is 37 C) • Mild to strong shivering occurs • Hands become numb, can’t do complex tasks • Blood vessels in outer extremities constrict • Breathing becomes quick and shallow • Goose bumps appear
Hypothermia Stages • Stage 2 http://en.wikipedia.org/wiki/Hypothermia • Body temperature drops to 2-4C below normal • Shivering becomes more violent • Lack of coordination apparent, e.g. stumbling • Mild confusion • Surface blood vessels contract further • Skin pallor becomes pale • Lips, ears, fingers and toes can turn blue
Hypothermia Stages • Stage 3 http://en.wikipedia.org/wiki/Hypothermia • Body temp. drops below 32C (90F) • Shivering usually stops • Difficulty speaking, slow thinking, amnesia • Inability to use hands and stumbling • Cellular metabolic processes shut down
Hypothermia Stages • Stage 3 (cont’d) • Body temp. drops below 30C (86F) • Walking nearly impossible • Incoherent or irrational behavior, even stupor • Pulse and respiration rates slow significantly • Heart arrhythmia; tachycardia, atrial fibrillation • Major organ failure. Clinical death occurs. • Decreased metabolism delays brain death
Hypothermia Preventionwww.mayoclinic.com COLD - Cover, Overexertion, Layers, Dry • Cover. Wear a hat to prevent body heat from escaping from your head, face and neck. Cover your hands with mittens instead of gloves. • Overexertion. Avoid activities that would cause you to sweat a lot. • Layers. Wear loose-fitting, layered, lightweight clothing. Outer clothing made of tightly woven, water-repellent material is best for wind protection. Wool, silk or polypropylene inner layers hold more body heat than cotton does. • Dry. Stay as dry as possible.
Hyperthermia • Stages http://en.wikipedia.org/wiki/Hyperthermia • Temperatures above 40°C (104°F) are life-threatening • 41°C (106 °F) brain death begins • 45°C (113°F) death is nearly certain • Core temperatures above 50°C (122°F) cause muscle rigidity and certain, immediate death
Hyperthermia • Stages http://en.wikipedia.org/wiki/Hyperthermia • In its advanced stage, hyperthermia is called heat stroke or sun stroke • Heat stroke is a medical emergency that requires hospitalization • Heat stroke can come on suddenly, but it usually follows the less-threatening condition of heat exhaustion or heat prostration, which in turn is often follows heat cramps
Heat Cramps www.mayoclinic.com/health/first-aid-heat-cramps • Mild form of heat exhaustion • Cramps in the calves, arms, abdomen and back, occurrence is common in athletes • Inadequate intake of fluids or electrolytes is very often a contributing factor • Treatment: rest and cool down; drink clear juice or electrolyte drink; stretch muscle group
Feeling faint or dizzy Nausea Heavy sweating Rapid, weak heartbeat Low blood pressure Cool, moist, pale skin Low-grade fever Heat cramps Headache Fatigue Dark-colored urine Heat Exhaustion Symptomswww.mayoclinic.com/health/first-aid-heat-exhaustion
Heat Exhaustion Treatmentwww.mayoclinic.com • Get the person out of the sun and into a shady or air-conditioned location. • Lay the person down, elevate the legs and feet slightly. • Loosen or remove the person's clothing. • Have the person drink cool water.
Heat Exhaustion Treatmentwww.mayoclinic.com • Cool the person by spraying or sponging them with cool water and fanning. • Monitor the person carefully. Heat exhaustion can quickly become heatstroke. • If fever greater than 102 F (38.9 C), fainting, confusion or seizures occur, dial 911 or call for emergency medical assistance.
Heat Stroke Symptomswww.mayoclinic.com • High body temperature of 104F (40C) or higheris the main sign of heat stroke. • Cessation of sweating.In heatstroke brought on by hot weather, your skin is hot and dry to the touch. In heatstroke brought on by strenuous exercise, your skin usually feels moist. • Hyperventilation,rapid and shallow breathing.
Heat Stroke Symptomswww.mayoclinic.com • Rapid heart rate and pulse (tachycardia).Your blood pressure usually remains normal, but your pulse may increase to around 130 beats a minute, well above the normal level for adults (60 to 100). • Neurological symptoms.You may have seizures, lose consciousness, slip into a coma, hallucinate, or have difficulty speaking or understanding what others are saying. • Muscle cramps or weakness.Your muscles may feel tender or cramped in the early stages of heatstroke, but may later go rigid or limp.
Heat Stroke Treatmentwww.mayoclinic.com MEDICAL EMERGENCY! Doctor/hospital may administer… • Cold water immersion. (Currently out of favor.) • Evaporative cooling techniques. • Ice packs and cooling blankets. • Internal “flushing” techniques. • Medications to stop treatment-caused shivering.
Heat Index http://www.weather.gov/os/heat/index.shtml
Heat Injury Preventionwww.mayoclinic.com • Wear loose-fitting, lightweight clothing. • Seek a cooler environment. A good way to start cooling off is to get to a cooler environment, like an air-conditioned building or a shady spot. • Drink plenty of fluids. Staying hydrated helps your body sweat and maintain a normal body temperature. Avoid diuretics (alcohol, caffeine). • Take extra precautions with certain medications.
What is Density? Density (d) = Mass (M) per unit Volume (V) d = M/V Typical Units: kg/m3, gm/cm3 Mass = # molecules molecular weight (gm/mole) Avogadro number (6.023x10²³ molecules/mole)
Density Change Density (d) changes by altering either a) # molecules in a constant volume b) volume occupied by the same # molecules a b
What is Pressure? Pressure (p) = Force (F) per unit Area (A) Typical Units: pounds per square inch (psi), millibars (mb), inches Hg Average pressure at sea-level: 14.7 psi 1013 mb 29.92 in. Hg
Pressure Can be thought of as weight of air above you. (Note that pressure acts in all directions!) So as elevation increases, pressure decreases. Top Higher elevation Less air above Lower pressure Lower elevation More air above Higher pressure Bottom
Density and Pressure Variation Key Points • Both decrease rapidly with height • Air is compressible, i.e. its density varies Ahrens, Fig. 1.5
10 kg 10 kg 10 kg 10 kg 10 kg 10 kg Why rapid change with height? Consider a spring with 10 kg bricks on top of it The spring compresses a little more with each addition of a brick. The spring is compressible.
Why rapid change with height? Now consider several 10 kg springs piled on top of each other. Topmost spring compresses the least! Bottom spring compresses the most! The total mass above you decreases rapidly w/height. mass mass mass mass
Why rapid change with height? Finally, consider piled-up parcels of air, each with the same # molecules. The bottom parcel is squished the most. Its density is the highest. Density decreases most rapidly at bottom.
Why rapid change with height? Each parcel has the same mass (i.e. same number of molecules), so the height of a parcel represents the same change in pressure p. Thus,pressure must decrease most rapidly near the bottom. p p p p
Water versus Air Pressure variation in water acts more like bricks, close to incompressible, instead of like springs. Top Air: Lower density, Gradual drop Higher density Rapid decrease Top Water: Constant drop Constant drop Bottom Bottom
Top Bottom A Thinning Atmosphere Lower density, Gradual drop w/elevation Higher density, Rapid decrease w/elevation NASA photo gallery
Pressure Decreases Exponentially with Height Logarithmic Decrease • For each 16 km increase in altitude, pressure drops by factor of 10. 48 km - 1 mb 32 km - 10 mb 16 km - 100 mb 0 km - 1000 mb 1 mb 48 km 10 mb 32 km 100 mb 16 km Ahrens, Fig. 1.5
Equation for Pressure Variation We can Quantify Pressure Change with Height