Download
1 / 7
70 likes | 177 Views
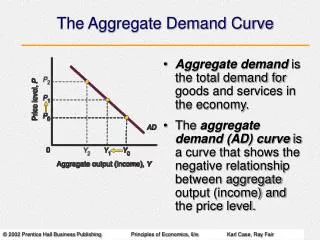
Explore demand curve analysis, profit maximization, and loss minimization in the bed frames rental industry. Learn how to optimize revenue and make informed business decisions.

E N D
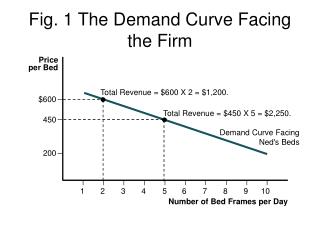
Price per Bed $600 450 200 1 2 3 4 5 6 7 8 9 10 Number of Bed Frames per Day Fig. 1 The Demand Curve Facing the Firm Total Revenue = $600 X 2 = $1,200. Total Revenue = $450 X 5 = $2,250. Demand Curve Facing Ned's Beds
Dollars $3,500 3,000 2,500 2,000 1,500 1,000 500 0 1 1 2 3 4 5 6 7 8 9 10 Output Fig. 2a Profit Maximization TC Profit at 7 Units Profit at 5 Units Profit at 3 Units TR DTR from producing 2nd unit DTR from producing 1st unit Total Fixed Cost
Dollars 600 500 400 300 200 100 0 Output 7 1 2 3 4 5 6 8 –100 –200 Fig. 2b Profit Maximization MC profit rises profit falls MR
Dollars Output Fig. 3 Two Points of Intersection MC A B MR Q1 Q*
Dollars TFC Output Q* Fig. 4a Loss Minimization
Dollars Output Fig. 4b Loss Minimization MC Q* MR
Dollars Output Fig. 5 Shut Down TC TVC Loss at Q* TFC TR TFC Q*