Download
1 / 19
190 likes | 450 Views
THE ROAD TO RESILIENCE: Measuring Resilience in Niger MYAP Communities. TOPS Knowledge Sharing Workshop Washington, DC November 13, 2012 David Leege, Catholic Relief Services. Background and Context. Sahel Drought Crisis Five Year PROSAN MYAP nearing completion

E N D
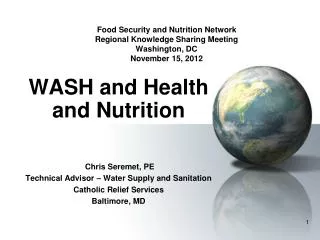
THE ROAD TO RESILIENCE: Measuring Resilience in Niger MYAP Communities TOPS Knowledge Sharing Workshop Washington, DC November 13, 2012 David Leege, Catholic Relief Services
Background and Context • Sahel Drought Crisis • Five Year PROSAN MYAP nearing completion • Challenge from USAID to measure impact (MYAP vs. non MYAP households) • Desire for agency-level learning as well as contribution to broader resiliency debate
PROSAN Multi-Year Assistance Program (2007-2012) • SO1: Protect livelihoods through increased agro- pastoral production and agro-enterprises • SO2: Improved health and nutrition status • SO3: Protect resilience and ability to identify and respond to recurrent shocks
Target Geographical Zones Targeted MYAP Communities Population Reached : 273,036 Number of women: 135,855 100 villages 70 villages 70 villages
MYAPInterventions • Agricultural Production: drought-resistant seeds, soil conservation, livestock restocking • Livelihoods: agro-enterprise and income generation: processing and value-added; business planning, literacy training, IGAs • Natural Resource Management: land reclamation, irrigation trenches, half moon construction, CFW/FFW • Water/Sanitation: Community Led Total Sanitation, latrine construction , hand dug wells and drip irrigation • Health and Nutrition: BCC, training of community health workers, clinic rehabilitation
Objective of the Study • To assess the resiliency of selected households that have benefited from the Multi-Year Assistance Program in Niger compared with households who were not supported. Key Questions: • Are households supported by Food for Peace more food secure during crises than households not supported by Food for Peace? • Do Food for Peace households consume more diverse and higher quality foods than households not supported by Food for Peace? • Do Food for Peace households have greater assets that effectively buffer against shocks? Do Food for Peace households use more positive coping strategies? • Are communities better equipped with social and physical infrastructure that mitigates shocks?
Methodology • Quantitative survey (n = 1,680 beneficiary & non-beneficiary households in 74 villages) • Food security status indicators • Household shocks • Household livelihood activities • Household adoption of specific risk management strategies • Household ownership/access to all forms of capital • Contextual information • Qualitative research toprovide deeper understanding of • HH perception of most severe shocks and particular problems faced • HH strategies to cope with or adjust to shocks and factors which constrain HH from reacting to shocks in ways that protect their resilience • Structures and processes in selected communities within the survey
Methodology • Determination of household resilience is based on an index comprising four key indicators that reflect three key dimensions of food security (availability, access, utilization) • Household hunger and coping strategies (FANTA III Household Food Insecurity Access Scale) • Dietary Diversity • Proportion of household expenditures on food • Livestock owned (measured in kg) • Vulnerability to poverty model (Chaudhuri et al., 2002) • Use of Propensity Score Matching (PSM) to account for the influence of targeting bias in explaining key differences in outcomes among comparable groups of beneficiary and non-beneficiary households. (modified n = 1,128)
Preliminary Results/Findings • Higher percentage of beneficiary HH adjusted food consumption (less quantity, lower quality) • Lower percentage of beneficiary HH resorted to sale of land (2.9% vs. 7.3%) or non-productive assets (20.7% vs. 25.8%), or had family members temporarily migrate (7.3% vs. 13.1%) • Beneficiary HH are more likely than non-beneficiaries to report having income-generating activities (42% vs. 32%) • Beneficiary HH report higher household dietary diversity than non-beneficiary HH (4.39 vs. 4.04)
Preliminary Results/Findings Coping strategies adopted during drought
Preliminary Results/Findings • Significantly more beneficiary HH having adopted positive agricultural changes (25% vs. 16%), and also plan to adopt positive agricultural changes in the future, compared to non-beneficiary HH (84% vs. 77%). • Significantly more beneficiary HH have access to irrigated land compared to non-beneficiary HH (18.1% vs. 8.4%). • Changes in agricultural practices that beneficiaries plan to adopt are related to intensification – using improved seed varieties and adoption of irrigation. • Both males and females in beneficiary HH report slightly higher educational attainment than non-beneficiary HH.
Lessons Learned • It was challenging to identify a true control group that has not benefitted from other forms of assistance or has similar characteristics as treatment group (We resorted to Propensity Score Matching to resolve this). • Perceptions of what constitutes shocks, adaptive and coping strategies may not be clear in a situation where “shocks” have become the norm. HH decisions not seemingly made based on risk assessment/mitigation. • Need to have a better understanding of indicators of community resilience vs. HH level outcomes. • Limited usefulness of expenditure data as a proxy for income in context where “successful” HH make fewer market purchases.
Lessons Learned • Analysis of vulnerability using a single cross-year, cross section data was less informative than expected. The vulnerability to poverty model, which looks at variation between predicted and actual values of outcome variables, was also not able to explain as much of the variation in the data as was anticipated. • This highlights the importance of having observations of households over time, to be able to look at how specific households react to specific shocks. (CRS may commission a follow-on study.) • HH with a larger number of IGA’s were less vulnerable, and it was important to note that virtually all of the IGA’s were agriculturally based, which underlines the value of business oriented training as a means of coping with shocks. • However, training is not a low-cost or quick return solution. This underscores the need for longer-term engagement with communities (3-5 years) in order to effectively improve adaptive capacity.
Next Steps • Further analysis of data (in particular access to irrigation, small ruminants and IGAs) • Further assessment of lessons learned • Publication and dissemination of findings • Workshops and webinars to share learning across CRS MYAP programs • Application of lessons to existing programs • Contribution to broader dialogue on resilience