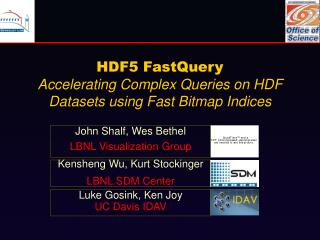
Taming Massive Distributed Datasets: Data Sampling Using Bitmap Indices
Taming Massive Distributed Datasets: Data Sampling Using Bitmap Indices. Yu Su*, Gagan Agrawal*, Jonathan Woodring # Kary Myers # , Joanne Wendelberger # , James Ahrens # *The Ohio State University # Los Alamos National Laboratory. Motivation. Science becomes increasingly data driven;

Taming Massive Distributed Datasets: Data Sampling Using Bitmap Indices
E N D
Presentation Transcript
Taming Massive Distributed Datasets: Data Sampling Using Bitmap Indices Yu Su*, Gagan Agrawal*, Jonathan Woodring# Kary Myers#, Joanne Wendelberger#, James Ahrens# *The Ohio State University #Los Alamos National Laboratory
Motivation • Science becomes increasingly data driven; • Strong requirement for efficient data analysis; • Challenges: • Fast data generation speed • Slow disk IO and network speed • Some number from road-runner EC3 simulation • 40003 particles, 36 bytes per particle => 2.3 TB/s • Network Bandwidth: 10 GB/s • 230 times different, and bigger in future • Extremely hard to download and analyze entire data
Server-side Subsetting Methods Client-side Subsetting Server-side Subsetting Challenges? No subsetting request? Data subset is still big? Simple Request Advanced Request
Data Sampling and Challenges • Statistic Sampling Techniques: • A subset of individuals to represent whole population • Example: Simple Random, Stratified Random • Information Loss and Error Metrics: • Mean, Variance, Histogram, Q-Q Plot • Challenges: • Sampling Accuracy Considering Data Features • Value Distribution, Spatial Locality • Error Calculation without High Overhead. • Combine Data Sampling with Data Subsetting • Data Sampling without Data Reorganization
Our Solution and Contribution • A server-side subsetting and sampling framework. • Standard SQL Interface • Bitmap Indexing • Server-side Subsetting: Dimensions, Values • Server-side Sampling • Support Data Sampling over Bitmap Indices • Data samples has better accuracy; • Support error prediction before sampling the data • Support data sampling over flexible data subset • No data reorganization is needed
Background: Bitmap Indexing • Widely used in scientific data management • Suitable for float value by binning small ranges • Run Length Compression(WAH, BBC) • Compress bitvector based on continuous 0s or 1s
System Architecture Find all bitvectors which satisfies current query Generate Query Request Calculate Errors based on bitvectors Parse the metadata file Perform sampling over bitvectors Access the actual dataset Parse the SQL expression
Data Sampling over Bitmap Indices • Features of Bitmap Indexing: • Each bin(bitvector) corresponds to one value range; • Different bins reflect the entire value distribution; • Each bin keeps the data spatial locality; • Contains all space IDs (0-bits and 1-bits) • Row Major, Column Major • Hilbert Curve, Z-Order Curve • Method: • Perform stratified random sampling over each bin; • Multi-level indices generates multi-level samples;
Stratified Random Sampling over Bins S1: Index Generation S2: Divide Bitvector into Equal Strides S3: Random Select certain % of 1’s out of each stride
Error Prediction vs. Error Calculation Error Calculation Error Prediction Data Sampling Multi-Times Error Prediction Sampling Request Predict Request Sample Error Metrics Feedback Sampling Request Sample Not Good? Decide Sampling Error Calculation
Error Prediction • Pre-estimate the error metrics before sampling • Bitmap Indices classifies the data into bins • Each bin corresponds to one value or value range; • Find some representative values for each bin: Vi; • Enforce equal sampling percentage for each bin • Extra Metadata: number of 1-bits of each bin: Ci; • Compute number of samples of each bin: Si; • Pre-calculate error metrics based on Vi and Si • Representative Values: • Small Bin: mean value • Big Bin: lower-bound, upper-bound, mean value
Error Prediction Formula • Q-Q Plot Mean, Variance: Histogram:
Data Subsetting + Data Sampling S1: Find value subset Value = [2, 3) RID = (9, 25) S2: Find Spatial ID subset S3: Perform Stratified Sampling on Subset
Experiment Results • Goals: • Data analysis efficiency with the help of sampling • Accuracy among different sampling methods • Compare Predicted Error with Actual Error • Efficiency among different sampling methods • Speedup for combining data sampling with subsetting • Datasets: • Ocean Data – Multi-dimensional Arrays • Cosmos Data – Separate Points with 7 attributes • Environment: • Darwin Cluster: 120 nodes, 48 cores, 64 GB memory
Improve Efficiency of Distributed Data Analysis with Sampling • Dataset: 11.2 GB Ocean Data • No Sampling(100%): zero sampling cost, but huge data transfer and visualization cost • Sampling: much smaller data transfer and visualization cost • 100 MB/s Network: data sampling achieves a 2.61 – 19.62 speedup • 10 MB/s Network: data sampling achieves a 4.82 – 47.59 total speedup • Data Sampling in server-side; • Data Transfer between client and server; • Data Visualization in client-side;
Sample Accuracy Comparison • Sampling Methods: • Simple Random Method • Stratified Random Method • KDTree Stratified Random Method • Big Bin Index Random Method • Small Bin Index Random Method • Error Metrics: • Means over 200 separate sectors • Histogram using 200 value intervals • Q-Q Plot with 200 quantiles • Sampling Percentage: 0.1%
Sample Accuracy Comparison • Mean • Q-Q Plot • Histogram Traditional sampling methods can not achieve good accuracy; Small Bin method achieves best accuracy in most cases; Big Bin method achieves comparable accuracy to KDTree sampling method.
Predicted Error vs. Actual Error • Means, Histogram, Q-Q Plot for Small Bin Method • Means, Histogram, Q-Q Plot for Big Bin Method
Efficiency Comparison Sample Generation Time Error Calculation Time Index-based Sample Generation Time is proportional to the number of bins(1.10 to 3.98 times slower). The Error Calculation Time based on bins is much smaller than that based on data (>28 times faster).
Total Time based on Resampling Times Total Sampling Time • Index-based Sampling: • Multi-time Error Calculations • One-time Sampling • Other Sampling Methods: • Multi-time Samplings • Multi-time Error Calculations • X axis: resampling times • Speedup of Small Bin: • 0.91 – 20.12
Speedup of Sampling over Subset Subset over Spatial IDs Subset over values X axis: Data Subsetting Percentage (100%, 50%, 30%, 10%, 1%) Y axis: Index Loading Time + Sampling Generation Time 25% Sampling Percentage Speedup :1.47 – 4.98 for Spatial Subsetting 2.25 - 21.54 for value Subsetting
Conclusion ‘Big Data’ issue brings challenges for scientific data management; Data sampling is useful and necessary for data analysis; Perform server-side sampling over bitmap indices; Pre-calculate errors before actually sampling data; Combine data sampling with data subsetting; Achieve good accuracy and efficiency.