Download
1 / 9
90 likes | 202 Views
Chapter 3 discussed analyzing relationships between quantitative variables showing LINEAR patterns. In chapter 4, we will analyze NON-LINEAR patterns. Section 4.1: Transforming Data to Achieve Linearity Example: Animal’s brain weight (g) vs. its body weight (kg).

E N D
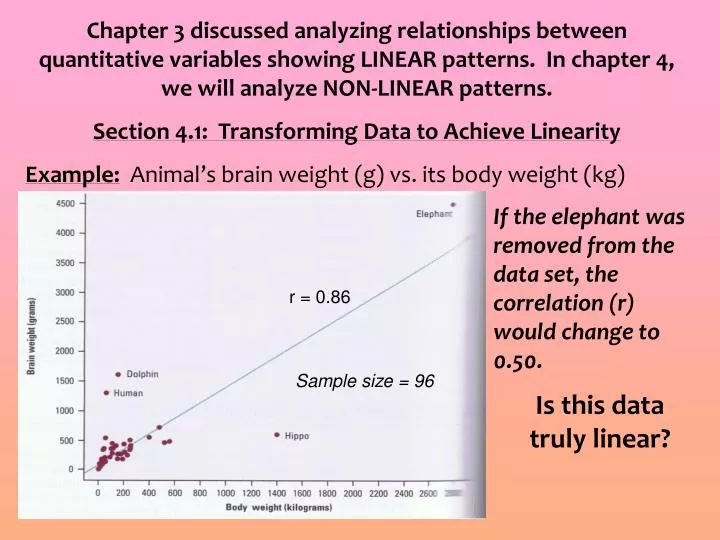
Chapter 3 discussed analyzing relationships between quantitative variables showing LINEAR patterns. In chapter 4, we will analyze NON-LINEAR patterns. Section 4.1: Transforming Data to Achieve Linearity Example: Animal’s brain weight (g) vs. its body weight (kg) If the elephant was removed from the data set, the correlation (r) would change to 0.50. r = 0.86 Sample size = 96 Is this data truly linear?
What if all 4 outliers were removed? Description: Positive association with a fairly weak, non-linear form So how can we find a model for this data?
We can transform or re-express the data. This involves changing the scale using a non-linear function. (Applying a function to the quantitative data values)
So, what will happen if we transform the animal data? Description: Positive association with a strong, linear form r = 0.96
How do you know which non-linear function to use? It depends upon the situation and how the variables are related. • Examples: • Your study involves the measuring the size of an object that is roughly spherical. Measurements of a sphere are in terms of its radius (r). Surface area would be in terms of r2 and volume in terms of r3, so either of these could be used. • Your study involves the measuring of a car’s gas mileage (mpg). This means t miles per gallon is the number of miles that can be traveled with 1 gallon of gas. Engineers prefer to measure gallons per mile, which would mean a reciprocal function 1/t or t -1could probably be used.
Let’s try one…. (refer to Fishing Tournament data) Positive association with a strong, non-linear form
Volumecube = side3 weight = length3 may model the relationship Positive association with a strong, linear form
r2 = 0.995 A residual plot may also be needed to double check reliability of the LSRL. Although there are higher residuals with higher weights, it is still safe to use the LSRL to model the data.
models the relationship between length and weight very well!
