Download
1 / 14
140 likes | 261 Views
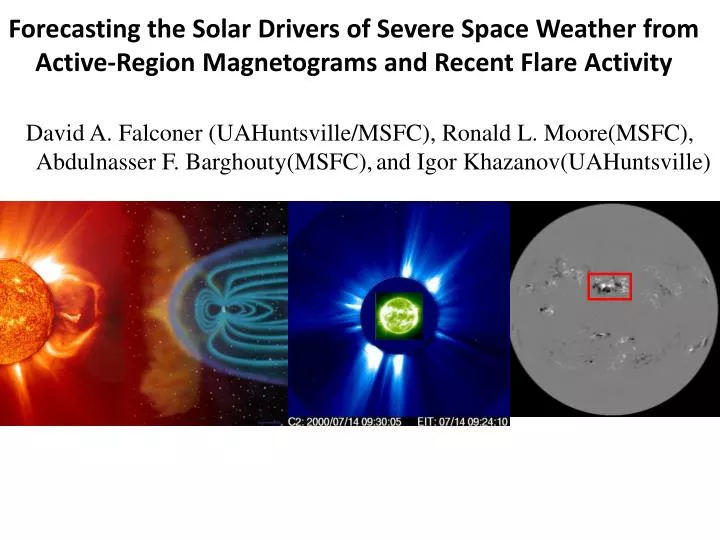
Forecasting the Solar Drivers of Severe Space Weather from Active-Region Magnetograms and Recent Flare Activity. David A. Falconer (UAHuntsville/MSFC), Ronald L. Moore(MSFC), Abdulnasser F. Barghouty(MSFC), and Igor Khazanov(UAHuntsville). Our Main Finding:.

E N D
Forecasting the Solar Drivers of Severe Space Weather from Active-Region Magnetograms and Recent Flare Activity David A. Falconer (UAHuntsville/MSFC), Ronald L. Moore(MSFC), Abdulnasser F. Barghouty(MSFC),and Igor Khazanov(UAHuntsville)
Our Main Finding: New empirical evidence shows that, in addition to depending strongly on the free magnetic energy, an active region's chance of having a major eruption depends strongly on other aspects of the evolving magnetic field (e.g., its complexity and flux emergence).
Overview • Describe the free-energy proxy • Show the free-energy forecast curves for major flares and fast CMEs • Show forecast curves for active regions that have recently produced X and M class flares
MSFC Vector Magnetogram of -Sunspot Source Region of a Major CME/Flare Eruption (2000 June 6) 25,000 km An active-region field’s horizontal shear is concentrated along neutral lines where the field’s horizontal component is strong and the vertical component’s horizontal gradient is steep. Observed-field upward (downward) vert. comp. is shown by solid contours or light shading (dashed contours or dark shading); red arrows show observed hor. comp. ; green arrows show hor. comp. of pot. field computed from obs. vert. comp. ; strong-observed-field (>150G) intervals of neutral lines are blue.
Free-energy proxy from vertical-field component of vector magnetogram or from line-of-sight magnetogram: • Active-region field’s free energy is concentrated in horizontal shear along neutral-lines intervals on which the horizontal component is strong and the vertical component’s horizontal gradient is steep. ●Deprojected vector magnetogram version WLSG=(BZ)dl or line-of-sight approximation LWLSG=(BLOS)dl. integration is along strong-field intervals of the AR neutral lines.
Forecast Curves (Ignoring Prior Flaring) Only active regions that have a large free energy are likely to produce major events in the next 24 hours.
Prior Flaring is Partly Separate from Free Energy as a Predictor of an Active Region CME/Flare Productivity Free Energy Only ----- Recently Flaring Recently Non-flaring
Forecast of 2012 March 7 X-Flare/SEP Eruption • Top panel: Free Energy proxy level and evolution. • Lower Panel: Forecast M&X flare rate • Forecast using free-energy proxy only • Forecast using Free-energy proxy and previous Flare History • Symbols + M-class Flares * X-class Flare & SEP
In Addition to Free-Energy, Something else that Persists on Periods of Days must be an Important Factor • Free-energy level of an active region persists over a timescale of days! • This persistence might have explained why previous flare activity is a good predictor of future flare activity. • But, after accounting for the free-energy proxy, prior flaring still has, additional predictive ability. • This shows that some other persistent factors must also play a role in causing eruptions.
Next Step: Find the additional Factors • Study active regions that have similar values of the free-energy proxy. • Indentify which active regions are more flare productive and which active regions are less productive. • Determined what factors differ between the two subsets • (not total magnetic flux/active region size) • Evolution • Complexity
Flux Content is Not an Important Additional Determinant Gray scale plot shows free energy/magnetic size distribution of 40,000 magnetograms of 1,300 active regions. Red contours are 0.001, 0.01, and 0.1, and 0.5 event/day levels.
SRAG MAG4 Forecast ToolExample Display (March 6, 2012) • Active region in upper-left corner produced the March 7 Solar Energetic particle event and geo-effective CME
BackupSRAG MAG4 Tool Forecast Before X5 Flare 2012/03/06 22:23 # AR# WL!DSG!N Lng Lat 24 Hour Event Rate Dist (kG) (deg) M&X CME FCME X SPE (deg) 3 11428 8 -21 -17 0.010 0.020 0.007 0.002 0.003 27 5 11429 69 -41 17 0.800 0.400 0.200 0.100 0.090 44! 6 11430 14 -25 20 0.040 0.040 0.020 0.006 0.007 32! Disk Forecast Rates 0.900 0.500 0.200 0.100 0.100 Multiplicative Uncertainties 2.7x 2.1x 2.3x 3.0x 2.5x Disk All-Clear Forecast Probabilities 40.00% 60.00% 80.00% 90.00% 91.00% Uncertainties 40.00% 20.00% 10.00% 10.00% 8.00%