Download
1 / 19
190 likes | 310 Views
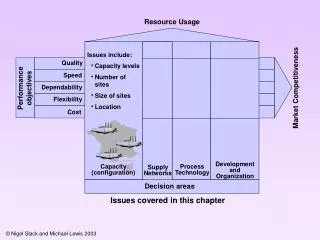
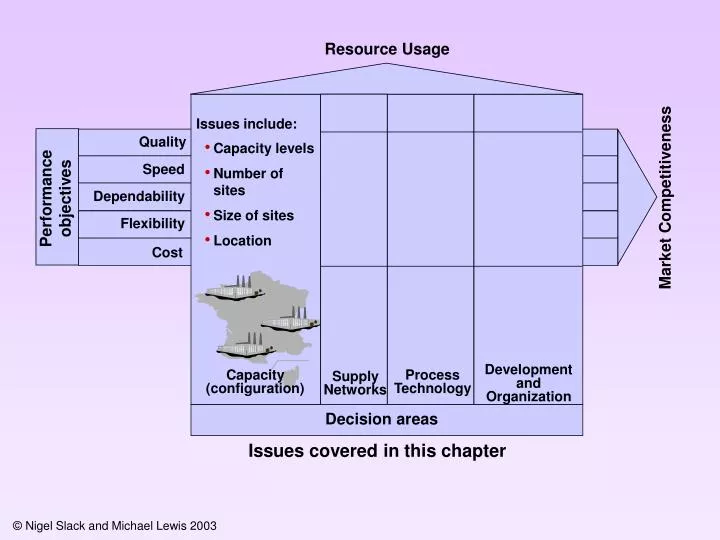
Resource Usage. Issues include:. Quality. Capacity levels Number of sites Size of sites Location. Speed. Performance objectives. Dependability. Market Competitiveness. Flexibility. Cost. Development and Organization. Capacity (configuration). Process Technology.

E N D
Resource Usage Issues include: Quality • Capacity levels • Number of sites • Size of sites • Location Speed Performance objectives Dependability Market Competitiveness Flexibility Cost Development and Organization Capacity (configuration) Process Technology Supply Networks Decision areas Issues covered in this chapter
Capacity Strategy Managing Capacity Change Configuring Capacity Magnitude of Change Overall Level of Capacity Location of Capacity Timing of Change Location of changed capacity Type of Capacity Issues in capacity strategy
Ice Cream Division Canned Food Division Actual output Effective capacity Actual output Effective capacity Efficiency Efficiency = = 3724 4134 4622 5437 = = 90.08% 85.01% = = Avoidable Loss Planned Loss Planned Loss Avoidable Loss Total Capacity Total Capacity 2459 hrs 410 hrs 815 hrs 3762 hrs 7896 hrs 7896 hrs Effective Capacity Effective Capacity Actual Output Actual Output 5437 hrs 4134 hrs 3724 hrs 3724 hrs Actual output Total capacity Actual output Total capacity Utilization Utilization = = 3724 7896 4622 7896 = 47.16% = 58.54% = = Utilization and efficiency measures for two divisions of a food processing company
Forecast level of demand Availability of capital Cost structure of capacity increment Changes in future demand Overall level of capacity OPERATIONS RESOURCES MARKET REQUIREMENTS Uncertainty of future demand Economies of scale Flexibility of capacity provisions Consequences of over/under supply Some factors influencing the overall level of capacity
Issues include….. NUMBER OF SITES CAPACITY OF EACH SITE LOCATION OF EACH SITE a LONG-TERM CAPACITY CHANGE STRATEGY ALLOCATION OF TASKS TO EACH SITE
Many small sites? NUMBER OF SITES and CAPACITY OF SITES Few larger sites? Supply side dominated? LOCATION OF SITES Demand side dominated? All sites make all products/services? ALLOCATION OF TASKS TO SITES Each site focuses on a few products/ services? Capacity leads demand? LONG-TERM CAPACITY CHANGE STRATEGY Capacity lags demand? Questions: “Who should be involved in these decisions?” “How does the company make this type of decision?” Questions Options
Why is capacity strategy important? Without an appropriate capacity strategy operations will always be struggling to supply markets in a competitive manner Getting capacity strategy right is the starting point for developing competitive operations
How should one judge a capacity strategy ? NUMBER OF SITES What performance measures will all these decisions have a major impact on ? CAPACITY OF EACH SITE LOCATION OF EACH SITE ? LONG-TERM CAPACITY CHANGE STRATEGY ALLOCATION OF TASKS TO SITES
Capacity Capacity Should capacity lead or lag demand ? Capacity leads demand Capacity lags demand Demand Demand Volume Volume Time Time • What competitive objectives will be affected?
The three options ….. Demand Capacity Leading Strategy Capacity Volume Time Time Demand Capacity Lagging Strategy Capacity Volume Time Demand Capacity Smoothing Strategy Capacity Volume Time
12 10 8 Cost Forecast demand = 9000 units Costs / Revenue ($) 6 4 Revenue 2 0 0 2 4 6 8 10 12 Volume in thousands of units Cost, volume, profit illustration
8 8 6 6 Diseconomies of scale kick in Unit cost (total cost / volume) Unit cost (total cost / volume) Nominal capacity limit 4 4 2 2 0 0 0 1 2 4 5 6 0 1 2 3 4 5 6 3 Volume in thousands of units Volume in thousands of units (a) (b) Unit cost curve
Cash flow with extended physical capacity Cash flow with two identical capacity increments Physical capacity of facilities Demand Cumulative cash flow Volume Time Effective Capacity Time Expanding physical capacity in advance of effective capacity can bring greater returns in the longer term
Economies of scale Required service level Size and number of sites OPERATIONS RESOURCES MARKET REQUIREMENTS Geographical distribution of demand Supply costs Some factors influencing the number and size of sites
Required service level Resource costs Land and facilities investment Suitability of site Location of sites OPERATIONS RESOURCES MARKET REQUIREMENTS Resource availability Image of location Community factors Some factors influencing the location of sites
London (city) Hong Kong New York (midtown) Singapore Stockholm Amsterdam Madrid 0.4 0.6 0.8 1.0 1.2 Office rents in various cities ($’000 per square metre, January 1999) Source: Richard Ellis, The Economist
Denmark Britain Japan France Germany Sweden Netherlands Spain United States = 100 160 140 60 80 100 120 Unit labour costs in various countries (1998) (includes effects of currency exchange rates and productivity) Source: OECD, The Economist
Electronics manufacturer Fast food restaurant Revenue Revenue Costs / Revenue Costs / Revenue Costs Costs Location A Location B Location A Location of operation Location of operation (a) (b) (a)Location concerned with profit maximization; (b)Location concerned with cost minimization
$US 4m Revenue 3m 3 Brayford facilities 2m 1 Bi-line 8 facility & 1 Brayford facility 1m 150000 Current volume 1000 2000 3000 4000 Monthly volume (kg) Cost-volume-profit curves for two alternative capacity strategies