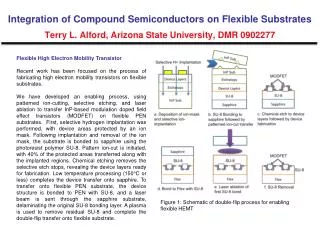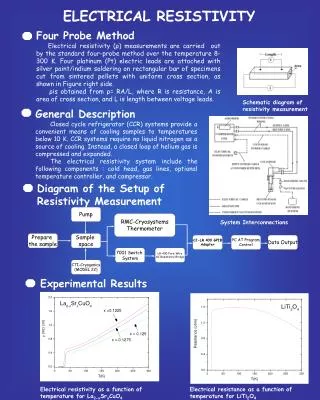
Percolation Effects on Electrical Resistivity and Electron Mobility
170 likes | 526 Views
Percolation Effects on Electrical Resistivity and Electron Mobility. By: Jared Weddell. University of Illinois at Chicago. Department of BioEngineering. [Mott Corporation, 2009]. Overview. Introduction Motivation Project Overview Methods Results Conclusion.

Percolation Effects on Electrical Resistivity and Electron Mobility
E N D
Presentation Transcript
Percolation Effects on Electrical Resistivity and Electron Mobility By: Jared Weddell University of Illinois at Chicago Department of BioEngineering [Mott Corporation, 2009]
Overview • Introduction • Motivation • Project Overview • Methods • Results • Conclusion
Percolation : Study of the movement of mass across a porous material.1 • How a porous metal allows flow of electrons across surface Example of a network used in percolation studies [Wikipedia, 2006] 1: B. Last and D. Thouless: Physical Review Letters, 1971, 27, 1719 – 1722.
Project Overview • To determine electrical resistance as a function of porous cuts in a conductive sheet • Determination of percolation threshold - area when resistance becomes infinite • Establish an experimental method for performing percolation studies • Application: To describe transport quantities such as thermal conductivity, elastic module, and diffusion constant
Matlab creates the random system of networks to analyze. AutoCAD visualizes the network and communicates with a laser that makes the cuts. Random ellipse network created by Matlab. The left section is the percolation sheet of interest while the right displays how much area remains in the left section.
Percolation threshold found by comparing current of the left and right side as pores are being cut. The current vs. time of the percolating sheet (blue) and equivalent area sheet (red). The black line shows the area threshold is found by observing the equivalent area current at the point where the percolation current becomes zero.
Ellipses are the major pore type of interest in this study. The threshold will change based on aspect ratio b/a.2 [Wikipedia, 2009] Ellipse with major axis a and minor axis b. The resistance will vary depending on aspect ratio b/a used. 2: S. Vellaichamy, B. Prakash, and S. Brun. Computers & Structures, 1990, 37, 241-246.
Comparing experimental ellipse data to theoretical results from Xia and Thorpe.3 • Find the percolation threshold of a trial using elliptical pores with a certain aspect ratio and compare against other aspect ratios. • The number of elliptical pore cuts is held constant across all trials. 0.7 0.15 0.0025 3: W. Xia, and M. F. Thorpe: Physical Review A, 1988, 38, 2650 – 2656.
Comparing experimental ellipse data to theoretical results. 0.7 0.15 Uncertainty for all experimental thresholds is +0.0011 0.0025 3: W. Xia, and M. F. Thorpe: Physical Review A, 1988, 38, 2650 – 2656.
Experimental ellipse percolation thresholds vs. theoretical values3 3: W. Xia, and M. F. Thorpe: Physical Review A, 1988, 38, 2650 – 2656.
Kerf Measurement • Kerf is the width of the cut made by the laser • Approximated kerf was 0.0020 inches (50 µm) • Measured kerf was 0.0071 inches (180 µm) • This difference leads to an uncertainty of error of 0.11% of the total area • Giving uncertainty +0.0011 to thresholds
Conclusion • As the aspect ratio approaches zero, the percolation threshold approaches one. • Experimental and theoretical results are in good agreement. • Variation comes from random nature of which the pores are cut.
Summary • Percolation studies useful for determining transport properties of materials. • Matlab and AutoCAD used to create percolating systems. • Experimental results agree with theoretical. Ellipses have higher percolation threshold at lower aspect ratios.
Acknowledgments • The financial support from the National Science Foundation, EEC-NSF Grant # 1062943 • Dr. Feinerman • Dr. Takoudis and Dr. Jursich