Download
1 / 102
1.03k likes | 1.17k Views
Comprehensive Ultrasound Research Platform. Emma Muir Sam Muir Jacob Sandlund David Smith Advisor: Dr. José Sánchez. Outline. Introduction Block Diagram Proposed System Functional Description Requirements Preliminary Work Equipment Schedule. 2. Outline. Introduction

E N D
Comprehensive Ultrasound Research Platform Emma Muir Sam Muir Jacob Sandlund David Smith Advisor: Dr. José Sánchez
Outline • Introduction • Block Diagram • Proposed System • Functional Description • Requirements • Preliminary Work • Equipment • Schedule 2
Outline • Introduction • Block Diagram • Proposed System • Functional Description • Requirements • Preliminary Work • Equipment • Schedule 3
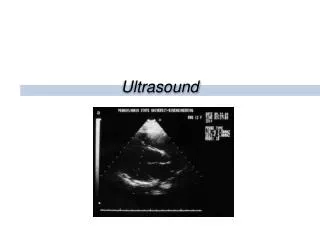
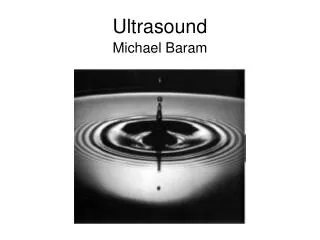
Ultrasound Introduction • Medical Applications • Detecting tumors and abnormalities • Piezoelectric Transducer • Pulse Excitation • Changes in density reflect waves 4
Outline • Introduction • Block Diagram • Proposed System • Functional Description • Requirements • Preliminary Work • Equipment • Schedule 5
Outline • Introduction • Block Diagram • Proposed System • Functional Description • Requirements • Preliminary Work • Equipment • Schedule 7
System Requirements • Up to 8 transducer channels • Excitation waveforms 3 μs or less • Time-bandwidth product of 40 • Design for high frequency • Signal to noise ratio (SNR) > 50 dB 8
Waveform Generation • Resolution Enhanced Compression Technique (REC) • Pre-enhanced chirp calculated with convolution equivalence • Increase Bandwidth (BW) of outputted signal • Improves resolution 10
REC Technique h1(n) * c1(n) = h2(n) * c2(n) h1(n) = Transducer Impulse Response h2(n) = IR with increased BW c2(n) = Linear chirp c1(n) = Calculated pre-enhanced chirp 11
REC Requirement • Enhance the bandwidth of the transducer to 12.45 MHz • Original bandwidth: 8.3 MHz • Increase resolution 12
Sigma Delta Modulation Analog to digital conversion technique 1-bit ADC Oversampling Quantization error compensation Signal values either 1 or -1 Sigma Delta Toolbox
Sigma Delta Modulation • 10% mean squared error • Chirp signal from 4MHz to 12MHz • Based on REC signal • 1.024 Gsamples/second • FPGA sampling rate = 1.06 Gsamples/second • Oversampling Rate (OSR) = 512 • T = 1 µs for testing, 3 µs for REC signal • OSR must be a power of 2 • 1.024 GSamples/second = 2*OSR/T • Divide Amplitude of signal by 2 • Avoid overloading • High OSR • High order
Why FPGA? • Array, high speed • 8-pins • > 600 MHz • Accurate, uninterrupted transmission • Flexibility
FPGA Description • Store waveform data • Needs to be high speed • Individual data for each pin • Parallelize to pins • High-speed transmission • 1.07 GHz 22
FPGA Requirements • Connect to PC • 24 kbits • Store on DDR2 • 62.5 MHz required (266 MHz actual) • At least 8 waveforms • 3000 bits per waveform • Each pin individualized (8 pins) • Up to 5 ms delays • Different waveforms 23
FPGA System 26
FPGA to PC Communication • UART • 115200 baud • Send waveform data • Assign waveform to pins • Assign delay to pins • Start transmission 28
Block Diagram 29 29
High Voltage Amplifier Two parts Operational Amplifier H-bridge Op Amp Amplify the signal from the FPGA -1 V to +1 V, or 0 V to 3.3 V Amplify to 10 V Needed for H-bridge Slew Rate 30
High Voltage Amplifier H-bridge MOSFET configuration Will amplify from 10 V to ~100 V 100 V is a safe threshold for Ultrasound Must work at 1 Gsample/sec Output to ultrasonic transducer (or LPF) 31
Block Diagram 32 32
Low Pass Filter • Convert the sigma delta signal to analog • RC circuit will be used • Bandpass nature of the source could be the filter • More research needed 33 33
Block Diagram 34 34
Ultrasonic Transducer 128-channel linear array Will only be using 8 channels 35
Block Diagram 36 36
T/R Switch Protects analog front end from high voltages Clamps voltages so damage is avoided 1.9 Vpp is specified TX810 by Texas Instruments 37
Printed Circuit Board • Design • Favor over perforated and bread board • Six layers predicted because of frequencies • Eliminates cross-talk and EMI • More research is being done to predict layout of the board 38 38
Block Diagram 39 39
Analog Front End • Two Parts • Low Noise Amplifier (LNA) • Analog-Digital Converter • Using AD9276-80KITZ provided by Analog Devices • Contains both parts • LNA • Will amplify the received signal from the ultrasonic transducer • Low amplitude from the transducer • High SNR 40 40
Analog Front End A-D Convert analog signal Will output digital signal to embedded device 41
Pulse Compression • Improve penetration depth and SNR • Techniques • Matched filter • Optimal for large amount of noise • Cross correlation • Creates side-lobes • Inverse filter • Optimal for zero noise • Inaccurate for large amount of noise 45
Pulse Compression • Wiener filter • Balance between matched and inverse filters based on SNR • Smoothing parameter • Can be used to optimize filter • Adjusts weighting of matched and inverse filter components 46
Beamforming Sensor 1 Sensor 2 Focus Distance (FD) Sensor 3 Sensor 4 Sensor 5 Sensor 6 Sensor 7 Sensor Distance (SD) Sensor 8 48
Beamforming Delays based on Focus Distance (FD) and Sensor Distance (SD) ∆t1 = [(FD^2 + (½*SD)^2)^0.5 – FD]*(2/1540) ∆t2 = [(FD^2 + (1½*SD)^2)^0.5 – FD]*(2/1540) ∆t3 = [(FD^2 + (2½*SD)^2)^0.5 – FD]*(2/1540) ∆t4 = [(FD^2 + (3½*SD)^2)^0.5 – FD]*(2/1540) 1540 m/s is the speed of sound in tissue Multiply by 2 to account for distance travelled in both directions 49
Beamforming Sensor 1 Sum Sensor 8 Sensor 2 Sum Delay ∆t4 -∆t3 Sensor 7 Sum Delay ∆t4 -∆t2 Sensor 3 Sum Output Sensor 6 Sensor 4 Sum Delay ∆t4 -∆t1 Sensor 5 50