Download
1 / 36
360 likes | 503 Views
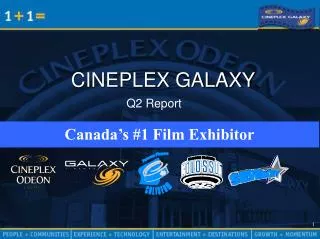
Cineplex Galaxy Income Fund 2006 Third Quarter. Cineplex Entertainment Circuit. Cineplex Odeon. Famous Players. Galaxy Cinemas. Theatres: 52 Screens: 507. Theatres: 54 Screens: 575. Theatres: 26 Screens: 227. As of September 30, 2006. Famous Players Acquisition - Rationale.

E N D
Cineplex Entertainment Circuit Cineplex Odeon Famous Players Galaxy Cinemas Theatres: 52Screens: 507 Theatres: 54Screens: 575 Theatres: 26Screens: 227 As of September 30, 2006
Famous Players Acquisition - Rationale The leading film exhibitor in Canada Accretive to distributable cash Complementary operations will lead to cost savings Opportunities to increase distributable cash through revenue growth Increase advertising market share and other income Addition of high quality theatres in metropolitan markets Superior combined management
Box Office Market Share Combined After Divestiture Cineplex Galaxy Cineplex Galaxy32.1% Cineplex Entertainment64.2% Empire 13.6% Other 6.9% Other 9.8% AMC 6.3% AMC 6.3% Empire 6.0% Landmark 3.1% Landmark 3.1% Guzzo 3.0% Guzzo 3.0% Famous Players42.6% Market Share of Canadian Box Office Revenues Source: A.C. Nielsen EDI data
Six Top-Tier Brands Colossus3 theatres Coliseum4 theatres SilverCity22 theatres Cineplex Odeon52 theatres Galaxy26 theatres Famous Players25 theatres As of September 30, 2006
Industry Overview Industry overview
Consistent Long-Term Box Office Revenue Growth CAGR since 1965: 5.6% Canadian Recessionary Periods Canadian Box Office Revenue1965 - 2005
Industry Box Office 2005 Q3 2006 YTD Canadian Industry* Cineplex Entertainment -8.6% + 2.0% -6.1% +4.5% * Source: Motion Picture Theatre Associations of Canada
Highest Grossing Films Released in 2005 Star Wars: Episode III$380 M The Chronicles of Narnia $291 M Harry Potter and Goblet of Fire$290 M War of the Worlds$234 M King Kong$218 M Source: Box Office Mojo
Highest Grossing Films Released in 2006 Pirates of the Caribbean 2$421 M Cars$244 M X-Men: The Last Stand$234 M The Da Vinci Code$217 M Superman Returns$199 M Source: Box Office Mojo
Upcoming Films for 2006 Happy FeetNovember 2006 Charlotte’s WebDecember 2006 Night at the Museum December 2006 Casino Royale November 2006 The Santa Clause 3 November 2006
Company overview
Increasing Revenue per Guest $12.28 $12.51 $11.23 $10.84 $10.27 $9.83 Revenue per Guest
Synergies Reducing overhead costs and adopting best practices Consolidating two head offices Staff reductions Adopting best practices Enhanced revenues Operating savings Media sales efficiencies and effectiveness Creation of Cineplex Media Improved purchasing and merchandising opportunities Supplier contracts Merchandising strategies Concession management Three Core Synergies:
Acquisition Synergies Prospectus Q1 Current Annualized Synergies: ($ millions) General and Administrative $15 $15 $15 Media 5 5 9 Operations - 5 6 Total $20 $25 $30
Looking Into the Future Leverage Over 60 Million Guests MagazineIn-TheatreInteractive Media-WebLoyaltyNaming Rights
Growth Other income initiatives Digital pre-show network Cineplex Media Alternative programming Merchandising Theatre openings
Digital Pre-Show Network Rollout Plan Phase 1: Phase 2: April 1 LaunchToronto Extended Market Area- 21 Locations; 215 Screens CompleteNationwide - Additional 800+ ScreensTOTAL 89 theatres & 1020 screens
Cineplex Media Magazine publishing: Famous Magazine, Famous Kids, Famous Quebec In-theatre advertising: Magazine, onscreen, posters, monitors, buildings, naming rights
Loyalty Strategic Alliance To create Canada’s first and foremost entertainment loyalty program 60 million Cineplex guests - 132 Cineplex locations Strategic Alliance 967 Scotiabank Canadian branches – 6 million Scotiabank Canadian customers Includes media rights and naming rights for five Cineplex locations
Merchandising $3.74 $3.44 $3.04 $0.56 $0.39 $0.20 Concession Per Patron
New Theatres Brand Location Screens Opening Galaxy Milton 8 June Cineplex Odeon Brossard 16 June Galaxy Brockville 6 July Galaxy Saskatoon 12 September Cineplex Odeon Oshawa 10 Q4 Galaxy Collingwood 7 2007 SilverCity Burloak 12 2007 SilverCity Hamilton 10 2007/2008 Galaxy Brantford 8 2008 9 Theatres 89 Screens
Financial highlights
Annual Total Revenue 1,275 1,269 775 740 $740.0 394 678 613 $490.3 $353.7 $330.0 $316.4 $250.2 $197.5 Screen Count ($ millions) 2005 excludes divestitures and includes FP for partial year
Annual Attendance (millions) 2005 excludes divestitures and includes FP for partial year
Annual EBITDA EBITDA Margin Adjusted EBITDA Margins – LTM March 2005: CGX 20.2% FP 9.0% ($ millions) 2005 EBITDA excludes divestitures and non-recurring/transaction related items and includes FP for partial year
Total Revenue – 9 months ended September 30 +6.6% ($ millions)
Attendance – 9 months ended September 30 +2.9% (millions)
Adjusted EBITDA – 9 months ended September 30 +161% Margin 11.2% 6.1% 14.9% ($ millions)
Distributable Income (per unit)
Credit Facilities Development facility Capacity - $60 million Working capital facility Capacity - $50 million Term facility Capacity - $235 million