Download
1 / 31
330 likes | 526 Views
RELIABILITY-BASED STRUCTURAL OPTIMIZATION FOR POSITIONING OF MARINE VESSELS. B. J. Leira, NTNU, Trondheim, Norway P. I. B. Berntsen, NTNU, Trondheim, Norway O. M. Aamo, NTNU, Trondheim, Norway. Objective.

E N D
RELIABILITY-BASED STRUCTURAL OPTIMIZATION FOR POSITIONING OF MARINE VESSELS B. J. Leira, NTNU, Trondheim, Norway P. I. B. Berntsen, NTNU, Trondheim, Norway O. M. Aamo, NTNU, Trondheim, Norway
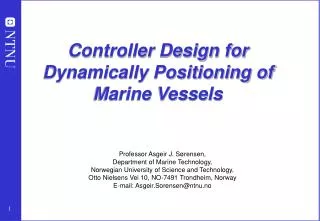
Objective • To investigate the possibility of implementing structural response and design criteria into the Dynamic Positioning control loop • Use a simplified quasistatic response model to derive optimal reliability levels for PID and LQG control schemes in conjunction with two different types of loss functions • Implement a control algorithm that is capable of achieving a given target reliability level for a realistic and fully dynamic system
Control of low-frequency response level Response time
Possible strategies for control algorithm based on reliability indices: • 1. Monitoring of reliability indices • 2. Weight factors based on reliability indices • 3. Derivation of optimal control criteria based on reliability indices
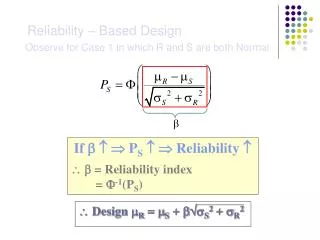
Principle: Measure of structural safety is the reliability index β which is related to the failure probability by β = Φ-1(pf) • No activation, β > βThreshold • Alert interval, increasing activation βThreshold > β > βCritical • Full Activation, β < βCritical ??? !!!
Definition of delta index is the mean breaking strength of the line (i.e. due to waves) is the standard deviation of the breaking strength
Computation of reliability index • Failure probability (pf) is probability that the extreme dynamic response will exceed critical level within a given reference duration • Failure probability is estimated for a stationary reference time interval of e.g. 20 minutes by application of a Gumbel distribution • Simplified relationship between delta-index and failure probability is expressed as: • pf = (-δ)
Simplified quasistatic load/response model is applied for initial ”optimization study” kTot∙r = FE - FT where is total linearized stiffness of mooring lines, FE is external (low-frequency) excitation and FT is thruster force Conversely: r = (FE – FT)/kTot
Two types of loss functions are considered: • Typical LQG type of loss function: L( r ) = KT·FT2 + KF·r2 (r is response, FT is thruster force, KT andKF are constants) • Loss function based on failure probability: L( r ) = KT·FT2 + KP·Ф(-δ)
Two different types of control schemes are considered: • PID control scheme: where e here is e= (rTarget – rstatic, passive) = (rTarget - FE/kTot) which (by neglecting second and last term) simplifies into: FT = Kp (rTarget – rstatic, passive) = Kp (rTarget - FE/kTot) • LQG control scheme: FT = -Cr Normalized control factor is: xc= C/kTot
First type of loss function versus vessel offset PID type of control scheme (KT∙kTot2)/KF = 1.0 and FE/kTot = 2.0
First type of loss function versus vessel offset PID type of control scheme (KT∙kTot2)/KF = 0.01 and FE/kTot = 2.0
Second type of loss function versus vessel offset PID type of control scheme (KT∙kTot2)/KF = 1.0 and FE/kTot = 2.0
Second type of loss function versus vessel offset PID type of control scheme (KT∙kTot2)/KF = 0.01 and FE/kTot = 2.0
Second type of loss function versus vessel offset PID type of control scheme (KT∙kTot2)/KF = 0.1 (intermediate value) and FE/kTot = 2.0
First type of loss function expressed in terms of normalized control variable - LQG type of control scheme (KT∙kTot2)/KF = 1.0 and FE/kTot = 2.0
First type of loss function expressed in terms of normalized control variable - LQG type of control scheme (KT∙kTot2)/KF = 0.01 and FE/kTot = 2.0
Second type of loss function expressed in terms of normalized control variable -LQG type of control scheme (KT∙kTot2)/KF = 1.0 and FE/kTot = 2.0
Second type of loss function expressed in terms of normalized control variable - LQG type of control scheme (KT∙kTot2)/KF = 0.01 and FE/kTot = 2.0
Vessel data: • Length of vessel: 175m • Beam: 25.4m • Draught: 9.5m. • Displaced volume: 24 140m3. • Mooring lines are composed of a mixture of chains and wire lines. • Representative linearized stiffness of the mooring system is 1.5∙104 N/m. • Mean value of breaking strength of single line is 1.128∙106 N • Standard deviation of the breaking strength is 7.5% of the mean value.
Numerical simulation model M is the inertia matrix is the hydrodynamic damping matrix η = [pT , ψ]T = [x, y, ψ]T is the position and heading in earth-fixed coordinates is the mooring force ν = [wT, ρ]T = [u, v, ρ]T is the translational and rotational velocities in body-fixed coordinates b is a slowly varying bias term representing external forces due to wind, currents, and waves is the thruster force
Notation: λ, γ and κ are strictly positive constants rj is the length of the horizontal projection of mooring line number j Tj’is the linearized mooring line tension in line j pj is the horizontal position of the end-point at the anchor for the same mooring line σb,j is the standard deviation of the breaking strength of line number j The target value of the reliability index is designated by δs. It can be shown that this controller is global exponentiallystable
Time variation of delta-index: In order for a delta-index of 4.4 to be optimal for the present case study, the ratio of (KT∙kTot2)/KPneeds to be 10-6, i.e. the failure cost needs to be very high compared to the ”unit thruster cost”.
Summary/conclusions: • A simplified model is applied in order to study optimal offset values (and corresponding values of the delta-index) when considering both the cost and reliability level • Two different loss functions are compared. The first type is quadratic in the response while the second is proportional to the failure probability • It is demonstrated for a particular example how structural reliability criteria can be incorporated directly into the control algorithm