Download
1 / 23
230 likes | 352 Views
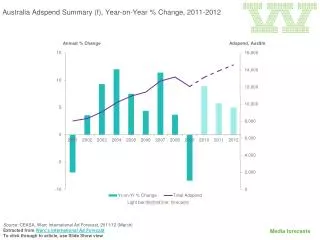
First half 2012 analysis on Global and SA adspend Trends. Global Advertising Trends. insights from the Nielsen Global AdView Pulse Q1 2012. Global consumer confidence is growing. and so does ADVERTISING. Source: Nielsen. Rising 3.1% YOY in Q1. ADVERTISING EXPENDITURE TREND. million USD.

E N D
Global Advertising Trends insights from the Nielsen Global AdView Pulse Q1 2012
and so does ADVERTISING Source: Nielsen
Rising 3.1% YOY in Q1 ADVERTISING EXPENDITURE TREND million USD Source: Nielsen Global AdView Pulse Q1 2012 Based mainly on published rate cards
Internet the fastest growing medium… 12.1% 3.1% Internet Newspapers 7.9% Radio 2.8% Television 6.4% Outdoor -1.4% Magazines 4.1% …while magazines show a dip Cinema
But TV holds the biggest share of spend Q1 2012 Television Newspapers Magazines Cinema Radio Outdoor Internet
Growth proceeds on different paces North America Asia Pacific ME & Africa Latin America West Europe +1.7% +2.1% +9.6% +23.3% -1.4% Western Europe sees a dip when comparing Q1 2012 vs. Q1 2011, on the back of the Euro-zone crisis
Press still commands +30% share in Europe and Asia Pacific Media -- % Share of Spend -- Q1 2012 Television Newspapers Magazines Source: Nielsen Global AdView Pulse Q1 2012. Note: Internet share is based on a smaller subset of countries included in the report and should only be taken as an indication. Cinema Radio Outdoor Internet
North America increases marginally +4.0%growth for TV North America +2.1% -5.0%decline for magazines Canada -0.5 -3.6%decline for Healthcare US +2.2% +8.6%growth forFinancial Q1 2012 vs Q1 2011
Europe sees a dip in spending +12.1%growth for Internet Europe -1.4% -1.2%decline for Television UK Germany -1.8% +2.1% +4.8%growth for Cloth. & Acc. France +3.9% Italy -5.0%decline forFMCG -7.6% Spain -14.0% Q1 2012 vs Q1 2011
Asia Pacific shows a marginal increase +5.4%growth for Newspapers Asia Pacific China +1.7% -2.5% -0.6%small dip for Television Japan +5.5% +9.1%growth for Entertainment Australia -4.8% -0.7%small dip forAutomotive Q1 2012 vs Q1 2011
Latin America performs very well Mexico +7.5%growth for TV -6.1% +7.6%growth for Magazines in 2011 Brazil Latin America +13.3%growth for Automotive +14.9% +9.6% Argentina +28.5%growth for Telecoms +16.8% Q1 2012 vs Q1 2011
Total all Media with print splitZAR (Millions) ZAR (Millions) Excluding SP
Media Split Jan – Jun 2012 ZAR (Millions) % =Share of Voice
Top 10 Daily Newspapers (Jan – Jun ‘12) ZAR (Millions) Excluding SP
Top 10 Weekly Newspapers (Jan – Jun ‘12) ZAR (Millions) Excluding SP
Top 10 Magazines (Jan – Jun ‘12) ZAR (Millions) Excluding SP
Top 10 Advertisers in Magazines (Jan – Jun ‘12) ZAR (Millions) Excluding SP
Top 10 Advertisers in Newspapers (Jan – Jun ‘12) ZAR (Millions) Excluding SP
Thank You! Milton Tshabalala (011) 495 3124 Milton.tshabalala@nielsen.com