Download
1 / 23
230 likes | 403 Views
Web-Based Impact Fee Analysis. Developing a Multi-Jurisdictional Congestion Mitigation Fee Program in Los Angeles County. Presented by: Michael Snavely, Cambridge Systematics, Inc. and Robert C á lix , Los Angeles County Metropolitan Transportation Authority May 10, 2011. Agenda.

E N D
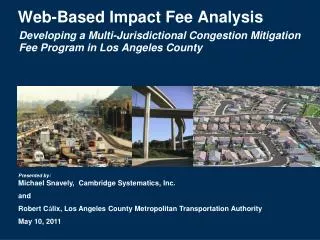
Web-Based Impact Fee Analysis Developing a Multi-Jurisdictional Congestion Mitigation Fee Program in Los Angeles County Presented by:Michael Snavely, Cambridge Systematics, Inc. and Robert Cálix, Los Angeles County Metropolitan Transportation Authority May 10, 2011
Agenda • Background/Need • Impact Fee Solution • Implementation Problem • Web-based Analysis • Results/Applications
BackgroundLos Angeles County 88 Cities + Unincorporated Areas 8 Subregional COGs
BackgroundLos Angeles County Growth 2010 - 2030 Development Growth Population Growth 25% / 7.5% 20% 2 million new residents 250,000 new housing units 400 million sq. ft. non-residential 10 million existing residents 3.4 million existing housing units 1.6 billion sq. ft. non-residential
Background:Los Angeles County: Strained Infrastructure Estimated Growth Through 2035
Los Angeles County: Transportation Funding Gap • Limited Federal Revenue Streams • California Budget Crisis • Local Revenue Streams Necessary (Figure: The Economist)
Solution: Congestion Mitigation Fee • Modest fee on new development based on projected impact on regional arterials • Directly funds transportation projects intended to mitigate impacts (improve capacity/reduce congestion)
Solution: Congestion Mitigation FeeCountywide & Regional Mitigation Fees Placer ElDorado* Shasta SanJoaquin Yolo Stanislaus Solano Merced ContraCosta* Madera Alameda* Fresno Santa Clara* Tulare Kings Kern San LuisObispo Los Angeles SanBernardino* Ventura Orange* Riverside* Fees Attempted SanDiego* Fees Adopted Fees Under Study * Transportation fees only
Congestion Mitigation FeeLimitations • Projects must: • Be specified at outset of program • Be located on the regional network • Mitigate new regional development impacts (add capacity) • Be financially constrained, i.e., fully funded with projected fees and other reasonably anticipated revenues • Projects can not: • Remedy existing deficiencies • Fund maintenance or operating expenditures
Solution: Congestion Mitigation FeeProgram Details • Fee Collection • Fee administered and collected directly by each jurisdiction from new development projects • Project Implementation • Funds allocated only to capital projects specified in program • Project constructed when sufficient funds are accumulated • Encourage subregional collaboration
How a Development Impact Fee Is CalculatedFour Basic Steps Step 1 Step 2 Verify population & employment forecastand convert to land use Convert new development to trip ends # new housing units new building sq. ft. # new trip-ends existing housing units existing building sq. ft. Adjust trip generation for exempt development
How a Development Impact Fee is Calculated(Continued) Step 3 Divide project cost by total number of new trip ends to determine cost per average daily trip Project Cost $679 per trip end $1.025 Billion 1,511,000 trip-ends
How a Development Impact Fee is Calculated(Continued) Step 4 Generate a fee schedule based on each land use category’s generation of average daily trips Average Daily Trip Generation Fee Land Use Rate Amounts Single Family (per unit)9.38$6,369 Multifamily (unit)5.75$3,904 Office (1,000 sq. ft.) 11.32$7,686 $679 trip end Retail (1,000 sq. ft.) 14.58$9,900 Industrial (1,000 sq. ft.) 7.16$4,862 Hotel/Motel (1,000 sq ft)12.32$8,365 Step 5 Revise and Refine to Reach Acceptable Level
Implementing a CMF in LA County • Problems: • Diversity • Complexity • Cost • Solutions: • Rolling Subregional Pilot Studies • Web-based CMF Tool
Solution: LA Metro CMF Web ToolFee Revenue and Growth Forecast Calculator Project Manager Growth Editor Fee Calculator Other Tools Mapping Navigation Tools Help Menu GHG Analysis Map Options
CMF Pilot Study Progress5 of 8 Subregions Complete or Underway
RecapCMF Benefit to Developers • Countywide Fee Provides • Consistency • Predictability • No longer require CMP deficiency plans, speeding up project approvals • Developers don’t pay for existing deficiencies
Generates new funding source for transportation projects Allows Metro to bring all cities in compliance with state Congestion Management Program Web tool offers: Spatial project database Growth projections Fee level refinements Easy CMF revisions every 5 years Off-model analysis capabilities RecapWeb-Based Congestion Mitigation Fee Program
Other Potential Applications • Accessible Project Database & Planning Tool • Call for Projects • GHG Calculator
CONTACT Michael Snavely Cambridge Systematics, Inc. Oakland, CA 510-873-8700 Robert Cálix Los Angeles County Metropolitan Transportation Authority 213-922-5644